HVF Method for calling the huge oil trade of 2020

Our 2019 chart for calling the oil short for 2020
How did we make the call on oil?
This page outlines the course of events leading up to the crash in the oil price and paints a picture of how, utilising HVF Method on macro time-frames, we are able to accurately scenariocast when the crash may occur and specific target levels projected into the future for trade opportunities.
It is almost uncanny how HVF Method is able to map out events and reveal “coincidences” that dovetail with macro economic and political events. Explore the timeline below to see how the story unfolded.
This page is best viewed on a desktop or laptop.
Ensure cookies are enabled for correct functioning and display of the page.
Oil trade timeline and event milestones
A prelude to the 2020 oil crash. Our bias to bear on energies
Signs already showing. In the YouTube below we set the scene and reasoning for our bearishness on the energies discussing oil, gas.
Previously on oil with HVF Method....
The oil crash call of 2014 post subprime, made prior to the price collapse using HVF Method. Trade triggered on 14 August 2014 with an expectation of overperformace to extreme lows.
Brent (W) trade triggered

Brent (W) post-trade target made with Volume analysis forming the basis of our next call for a resurgence in price..
PAA showing signs of weakness
Plains All-American (PAA) is a pipeline company engaged in moving and storing oil and other petroleum related materials.
Speculative trade entered on what we call an Early Entry (Advanced HVF Method) on structure that indicates weakness and a possible fall in PAA price may be imminent.
Bear in mind this is almost one year ahead of the actual oil crash. As part of the oil compex, PAA proved to be a good hunting ground for fruitful shorts with HVF structures indicating the potential for a marketcap decimation of 85+%
A potential RRR of 83.54 on this speculative entry.
PAA (Daily)

My personal, speculative Early Entry for PAA on a spread-betting account at $25.824 with a stop at an HVF Method-derived value of $27.764

Aramco drone strike. Stop out and re-entry
Drone strike on Saudi Arabia’s Aramco oil refineries demolishes Saudi oil output.

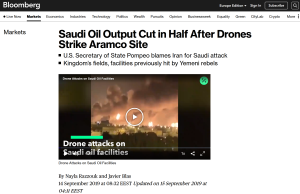
This event momentarily spiked the price of oil which stopped me out of the trade necessitating finding a re-entry price level. This was achieved by observing the subsequent broadening price action for which HVF Method provides specific theory and approach to its analysis. A massive daily rejection candle on the 8 January 2020 gave us a clue and the break of our broadening structure invited us to enter the trade again in and around the $58 level.
USD/WTI 1D
Fresh short entries on a revisit to a broadening structure based on HVF Method highlighted in the pink box.

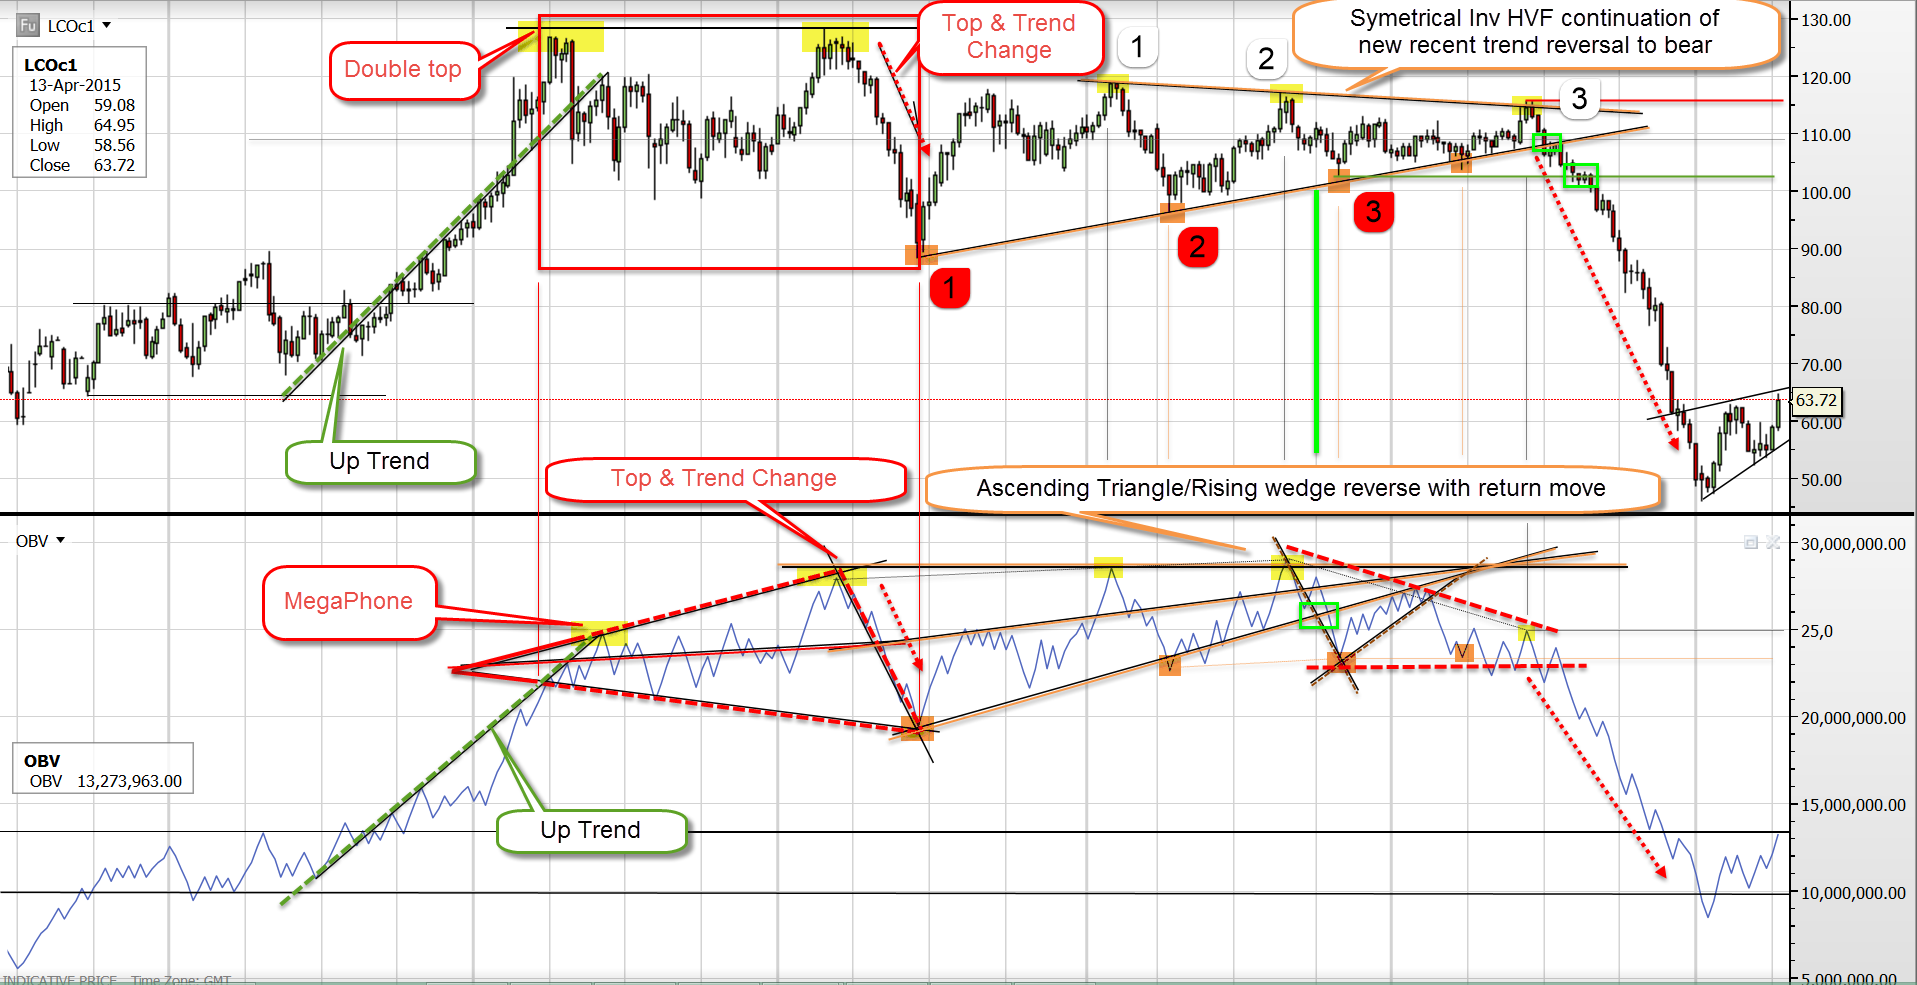
Oil's 15 year Falling Wedge and our Scenariocast
We scenariocast a third impulse to complete inside a 15 year Falling Wedge structure before a possible resumption to the upside. This third impulse gives us a basis to call a fall in the price of oil.

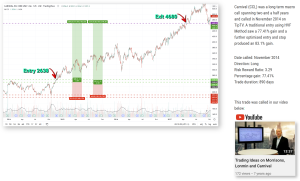
CCL trade
Auxilliary trades related to oil showing weakness.
Carnival Cruise Line (CCL) had been forming an iHVF over the past six months pointing to a possible spill from around mid-June to July 2019 based on oil’s macro signs of weakness.
CCL (4H)

Spilla-Thrilla
CCL triggers right on time and fell hard.

Subsequent strong recovery but did not invalidate the setup.
Eventually it made it’s HVF Method-derived and pre-determined target of $30.91
Plains All American Pipeline PAA, For whom the Grandfather clock tolls CCL, WFC Update
https://youtu.be/qTFI2kn4_jM?t=146
We’ve been here before…
This is not our first time trading Carnival Cruise Lines.
See our call to trade CCL to the upside from November 2014 that saw a handsome 77% gain.
CCL November 2014 long call
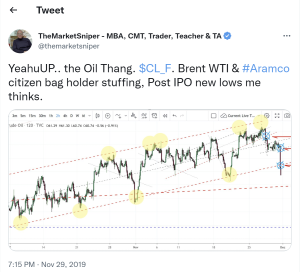
Aramco IPO or "Citizen bag holder stuffing"

Aramco had their IPO approved on the 3 November 2019.
We do not hold the view of great benevolence of the Saudi royal family surrounding the oil wealth of the nation. The Aramco IPO further supported our opinion that this could indeed be close to a top call prior to a demand destroying crisis for oil.
Statements of wanting to share the wealth of the nation with the citizenry suggested to us was a classic case of a top call, handing the bags of this new “benevolence” over to the citizens at the worst possible time, only to recollect them at the bottoms in a financially repressed time. This was our house view. As it turned out, it was indeed very good timing for that event to have taken place for the “insider” Saudi royal family wealth.
Commentary on The Market Sniper YouTube channel how the Saudi Monarchy “patsied” their own citizens with the Aramco IPO.
Part 1:
Part 2:
Premium Community enters PAA and CCL shorts
Our Premium Community gets first dibs on any trade ideas. Those in the Community who elected to participate in this trade were already positioned and in the trade before we went public with our short calls on PAA and CCL.
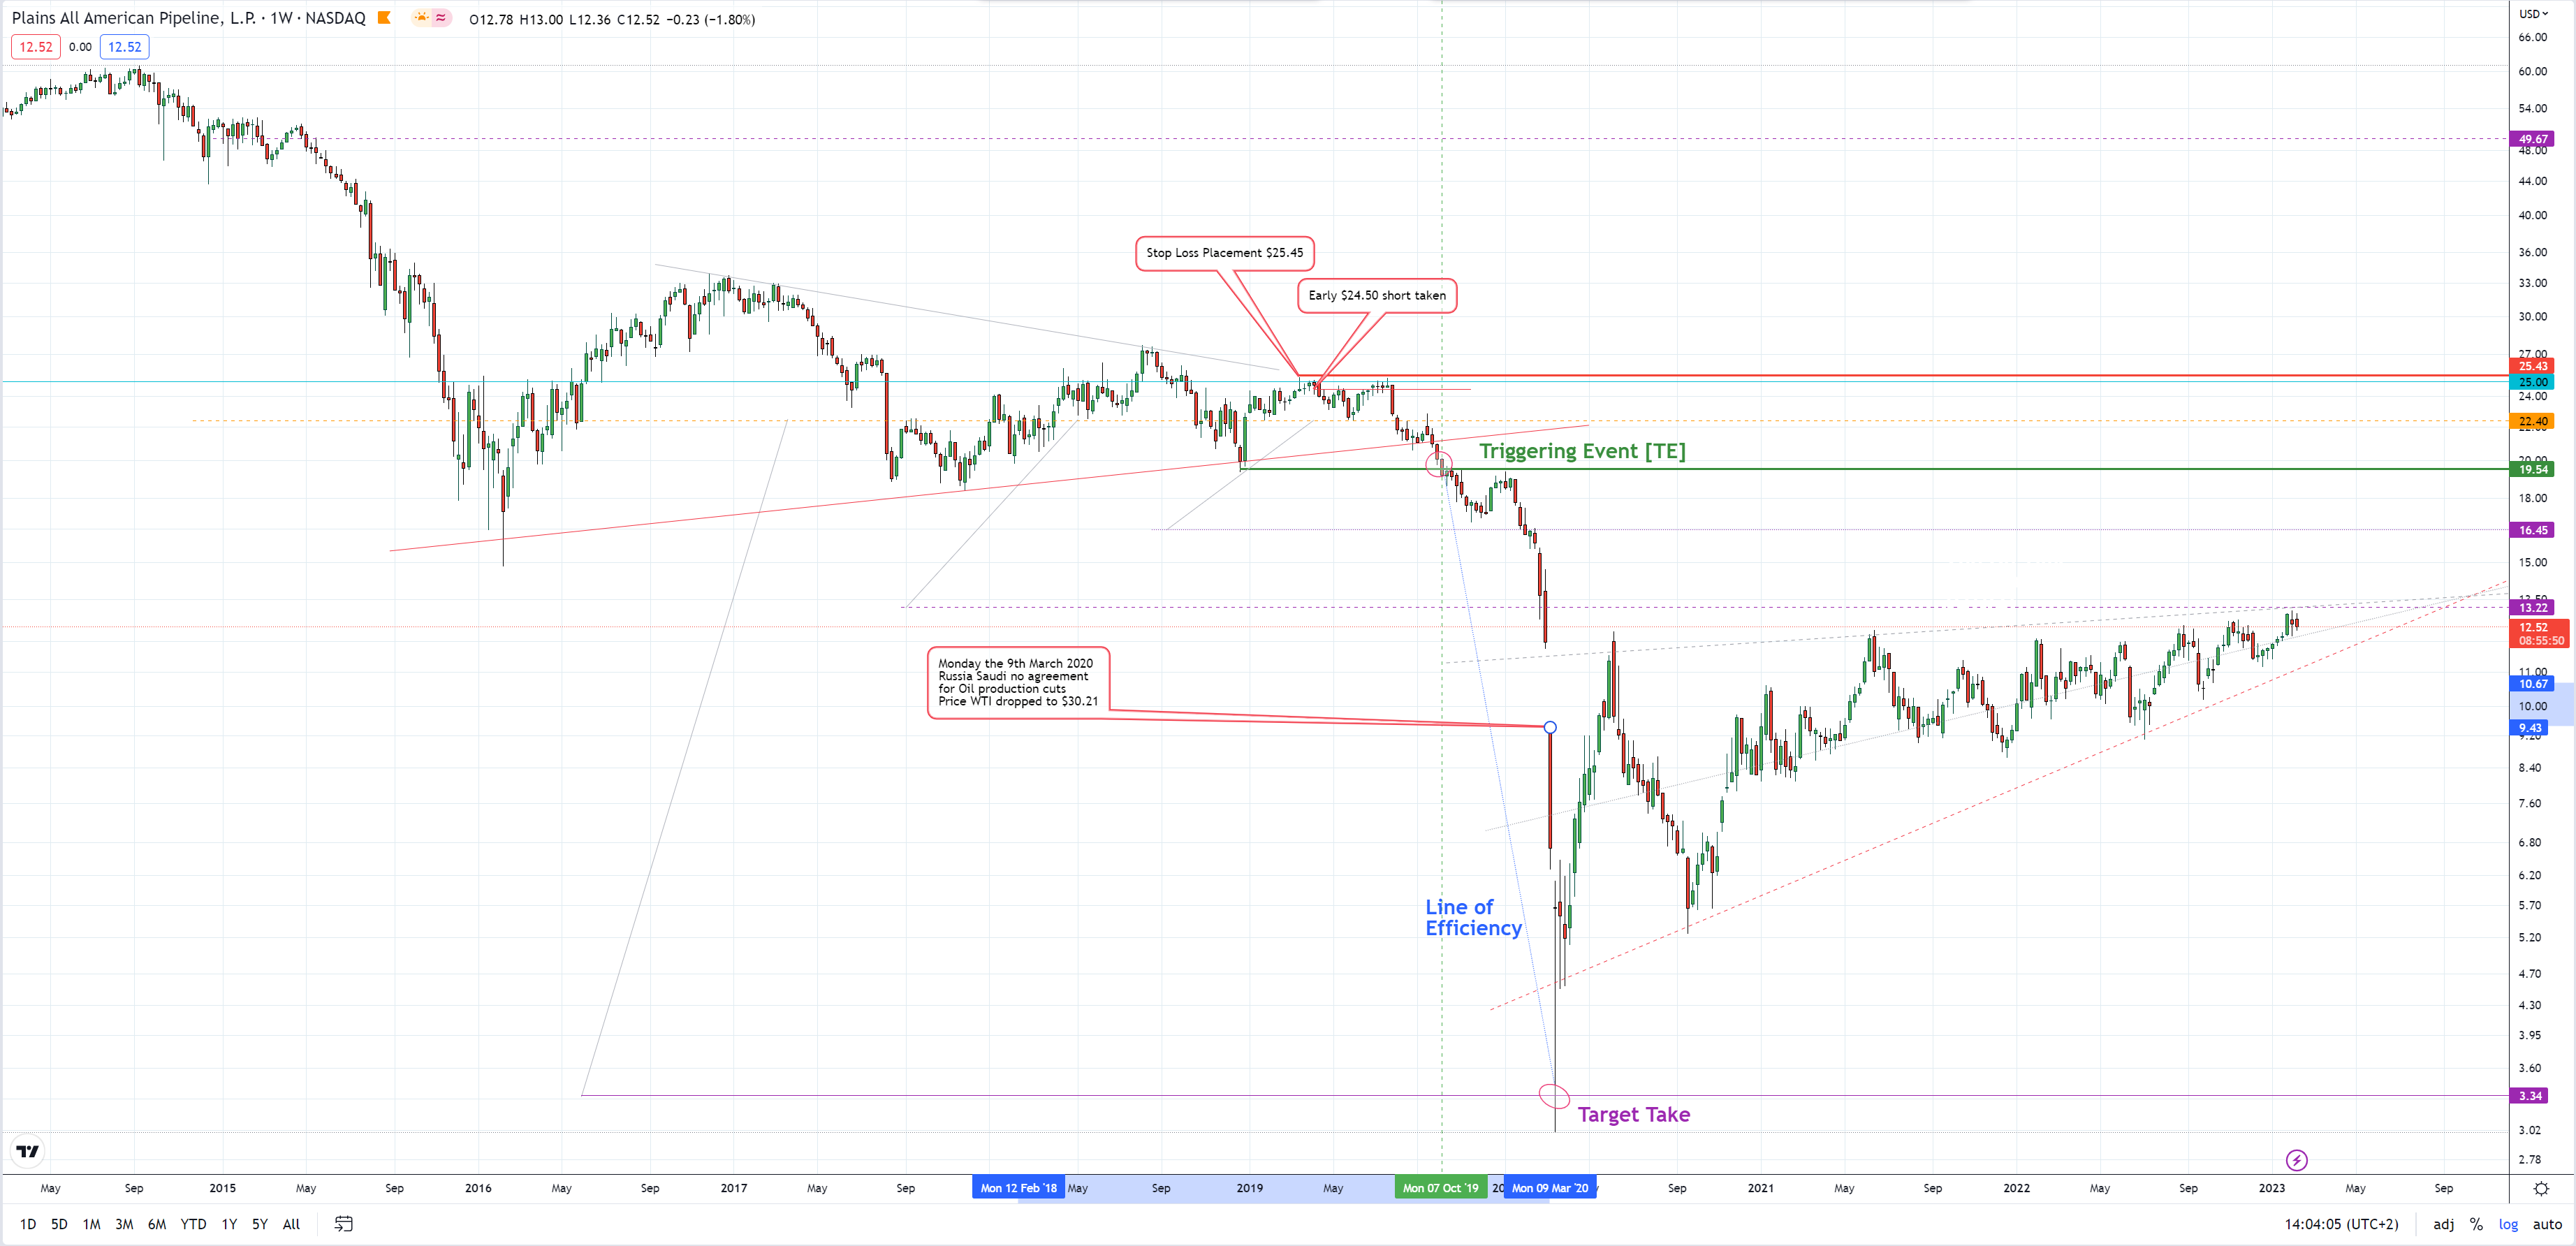
PAA (1W)

CCL (2D)

See our video below for the public call on PAA
US Indices Higher on Tech Big Data Thieves, PAA, CCL, USDKRW, China A50
https://www.youtube.com/watch?v=CkxRgCoNL5Y
Public call on oil to single digits, Anarcapulco, 12 February 2020
The news before the news with HVF Method
At Anarcapulco 2020 we made our public call of the potential of a major crash in the oil price to single digits. PPI were underpricing for single digit oil.
USD/WTI (6W) Falling Wedge modelling for the single digit call
One of the presentation slides (above) from Anarcapulcho 2020. The first red column illustrates the subprime crash of 2008, the second column shows the period where China loaded up on debt to become one of the most endebted countries in the world and bookmarked by what Jim Rikards called “The Shanghai Accord”
The news before the news: Oil 2020 12th of February
Oil gaps down $9.50 on open
Oil gapped down on open with Brent falling more than 25% on a Russian and Saudi oil glut. Supply over demand sees the price plummet.
USD/WTI CRUDE OIL (2H)
The infamous day oil gapped down.

Our YouTube livestream on the night of 8 March 2020 when oil gapped down on open.
Oil Gaps $9.5 Dollars in Russia/Saudi Glut
Crash makes the headlines
Headlines across the world light up on news of the crash and our Oil trade call is already well on it’s way to target.

Oil crash target made... and more
Oil crashes down through our target going to zero on the cash market and negative $42 on the futures.
USD/WTI (D)
Oil went sub-zero on the 19 April 2020

Post oil crash - Reset season is in
The Greatest “Coincidence”
Post crash synopsis and the implications. We setting the stage for an incoming currency crisis waiting in the wings which subsequently transpired.
The Reset season is in.. Here is the real news before the news
PAA short closed with 30.9 RRR. TLW trade closed
Our PAA trade ws closed at the pre-determined target of $3.19 with a great Risk Reward Ratio of 28 on an early entry 24.50. A more speculative entry at $25 could have even squeezed a ridiculous 100+ RRR!
PAA trade details:
Stop: 25.26
Early Entry: 24.50
Take profit: 3.19
RRR: 28.04
86.98% market cap decimation
HVF Method can also give you a second chance on a trade idea. The PAA trade allowed for a second chance entry at $19.54 which would have still reaped a 2.86 RRR, or with some judicious stop placement could have seen a 4.61 RRR.
PAA (1W) target made
PAA – Plains All American Pipeline, 82,5% MC short closed
Entries were taken across multiple platforms using spreadbets and options. The table below illustrates PNL taken on one of the options platforms.

Tullow Oil (TLW) Single digit target attained
The multinational oil and gas exploration company hits single digits and our pre-determined price target £0.086
Tullows share price gapped down after the company surprised investors by slashing its production forecast and news came out of the ousting of the chief executive and exploration director.
TLW trade details:
Stop: 2.506
Entry: 1.967
Target: 0.086
RRR: 3.53
TLW (2D) target made

Tullow Plc, TLW – Short to Single digit home & Hosed
Timeline of events leading up to crash
A retrospective draw illustrating the timeline of events from 2019 leading up to the crash.

Is now the time to buy?
An over reaction in price action to downside usually manifests an equal and opposite reaction to the upside. This presented a good opportunity to buy into oil.
Our Falling Wedge structure from 18 September 2019 scenariocast the potential to go long after a fall in the price of oil for which the subsequent reversal played out.
The Great Oil ‘Rig’, Is now the time to Buy Oil – From Mr Oil Short at $64
What was Gold doing during the oil crash?
As oil production plummeted in August of 2020, investors moved quickly into the safe haven of gold and silver as a hedge against a potential increase in inflation and a weaker Dollar. Canada’s oil rig count down over 86%!

In the months oil had been plotting structure for its future crash, gold had been setting up tradable upside structures which reinforced and validated our scenariocast for oil and call for short oil long gold. This provided a delta neutral positioning to reduce risk.
Gold will be covered in a separate case study, but provided a 50% move in approximately one year to our target of $1,508.
Gold/Oil (1W) setting up structure for an upside move prior to the oil crash.

Gold/Oil (1W) post the break saw extreme Overperformance well past our target levels.

Next big call - three-digit oil?
After a fall from 60’s to single digits, now calling for three-digit oil?
We now pivot to a macro time frame bull, especially on energies as well as commodities generally. At the time, this was on the back of a possible bond market top, debt market downturn and a possible series of interest rate hikes, all due to the lack of sound money.
The oil price structure played out as we had drawn our scenariocast from September 2019 with a move looking to break an almost two decade Falling Wedge with high momentum in one of the most inflationary environments that exists.
Oil for 3 digits coming sooner than you Think? Energy Market Dive
Technical break of macro Falling Wedge for the bull case
After its fall out of the bottom of the Falling Wedge to a technical floor of zero, which we refer to as a Type 2 Falling Wedge, oil recovered over the next few months.
A break of the macro time frame Falling Wedge confirms our bias to the upside and our modelling for a call for 3-digit oil.
USD/WTI (2W)

Epilogue - Top call after break of macro Falling Wedge
USD/WTI 2H
As an epilogue to the final capitulation to the low levels for oil and break of the Falling Wedge, we asserted on the 8th March 2022 that oil had made a top at $129.47 on the 9th February 2023.
In this view we illustrate: a breakaway from the Falling Wedge (it gapped on lower timeframes); the running and holding above $100; the subsequent battle to retain that which led to an ascending broadening structure that is sitting on a bullish green pole.
This is classic HVF Method for the expectation of a reversal.
Calling it at the time
USD/WTI 1H

In the rally that formed part of a break of the macro Falling Wedge into the levels above $100 there was a final exhaustive gap up that was filled on the downleg with a subsequent clinging, grinding price behaviour in and around the splitter of our Ascending Megaphone, which is very typical in HVF Method for price weakness to subsequently occur. The break occurred in the $126 to $124 range of the Megaphone splitter consolidation area shown as the tight channel in pink. The price subsequently spilled even further breaking the Megaphone Basing Ascending Grindline at approximately the $116 level.
This exhaustive behaviour between the 6th and 10th March 2022 was indicative that the oil markets had topped. This was a market we were observing closely and even suggested that oil’s upside had exhausted and a downturn was due.
Looking forward to today (9th February 2023) oil is trading $75 and has never made another high.
This chart illustrates the high call where a stop loss was placed at $129.47
Having called the collapse of oil to single digits, and the subsequent reversal, we captured the high of the rally that still holds true a year later, to where we are now (Ferbruary 2023) trading down at $75 along with talk of recession and tightening interest rates in a far more muted and contracting global economy.
Oils event timeline
2001 to 2023

Walk-through of the oil trade with Francis Hunt, The Market Sniper