HVF Method for calling 40K for Bitcoin 2023

Our February 2023 YouTube Video calling a 40K target
How did we make the call on for $40K Bitcoin?
This page outlines the course of Bitcoin’s journey to our anticipated target of $40,000 scenario-cast utilising HVF Method. It also gave us insight to potential trades in the ALTs markets and where to profitably put money to work.
It is almost uncanny how HVF Method is able to map out events and reveal “coincidences” that dovetail with macro economic and political events. Explore the timeline below to see how the story unfolded.
Click the icon below the images to see the original links for source material.
This page is best viewed on a desktop or laptop.
Ensure cookies are enabled for correct functioning and display of the page.
$40K Bitcoin’s (2023) timeline and event milestones
Indications of a possible incoming bull market
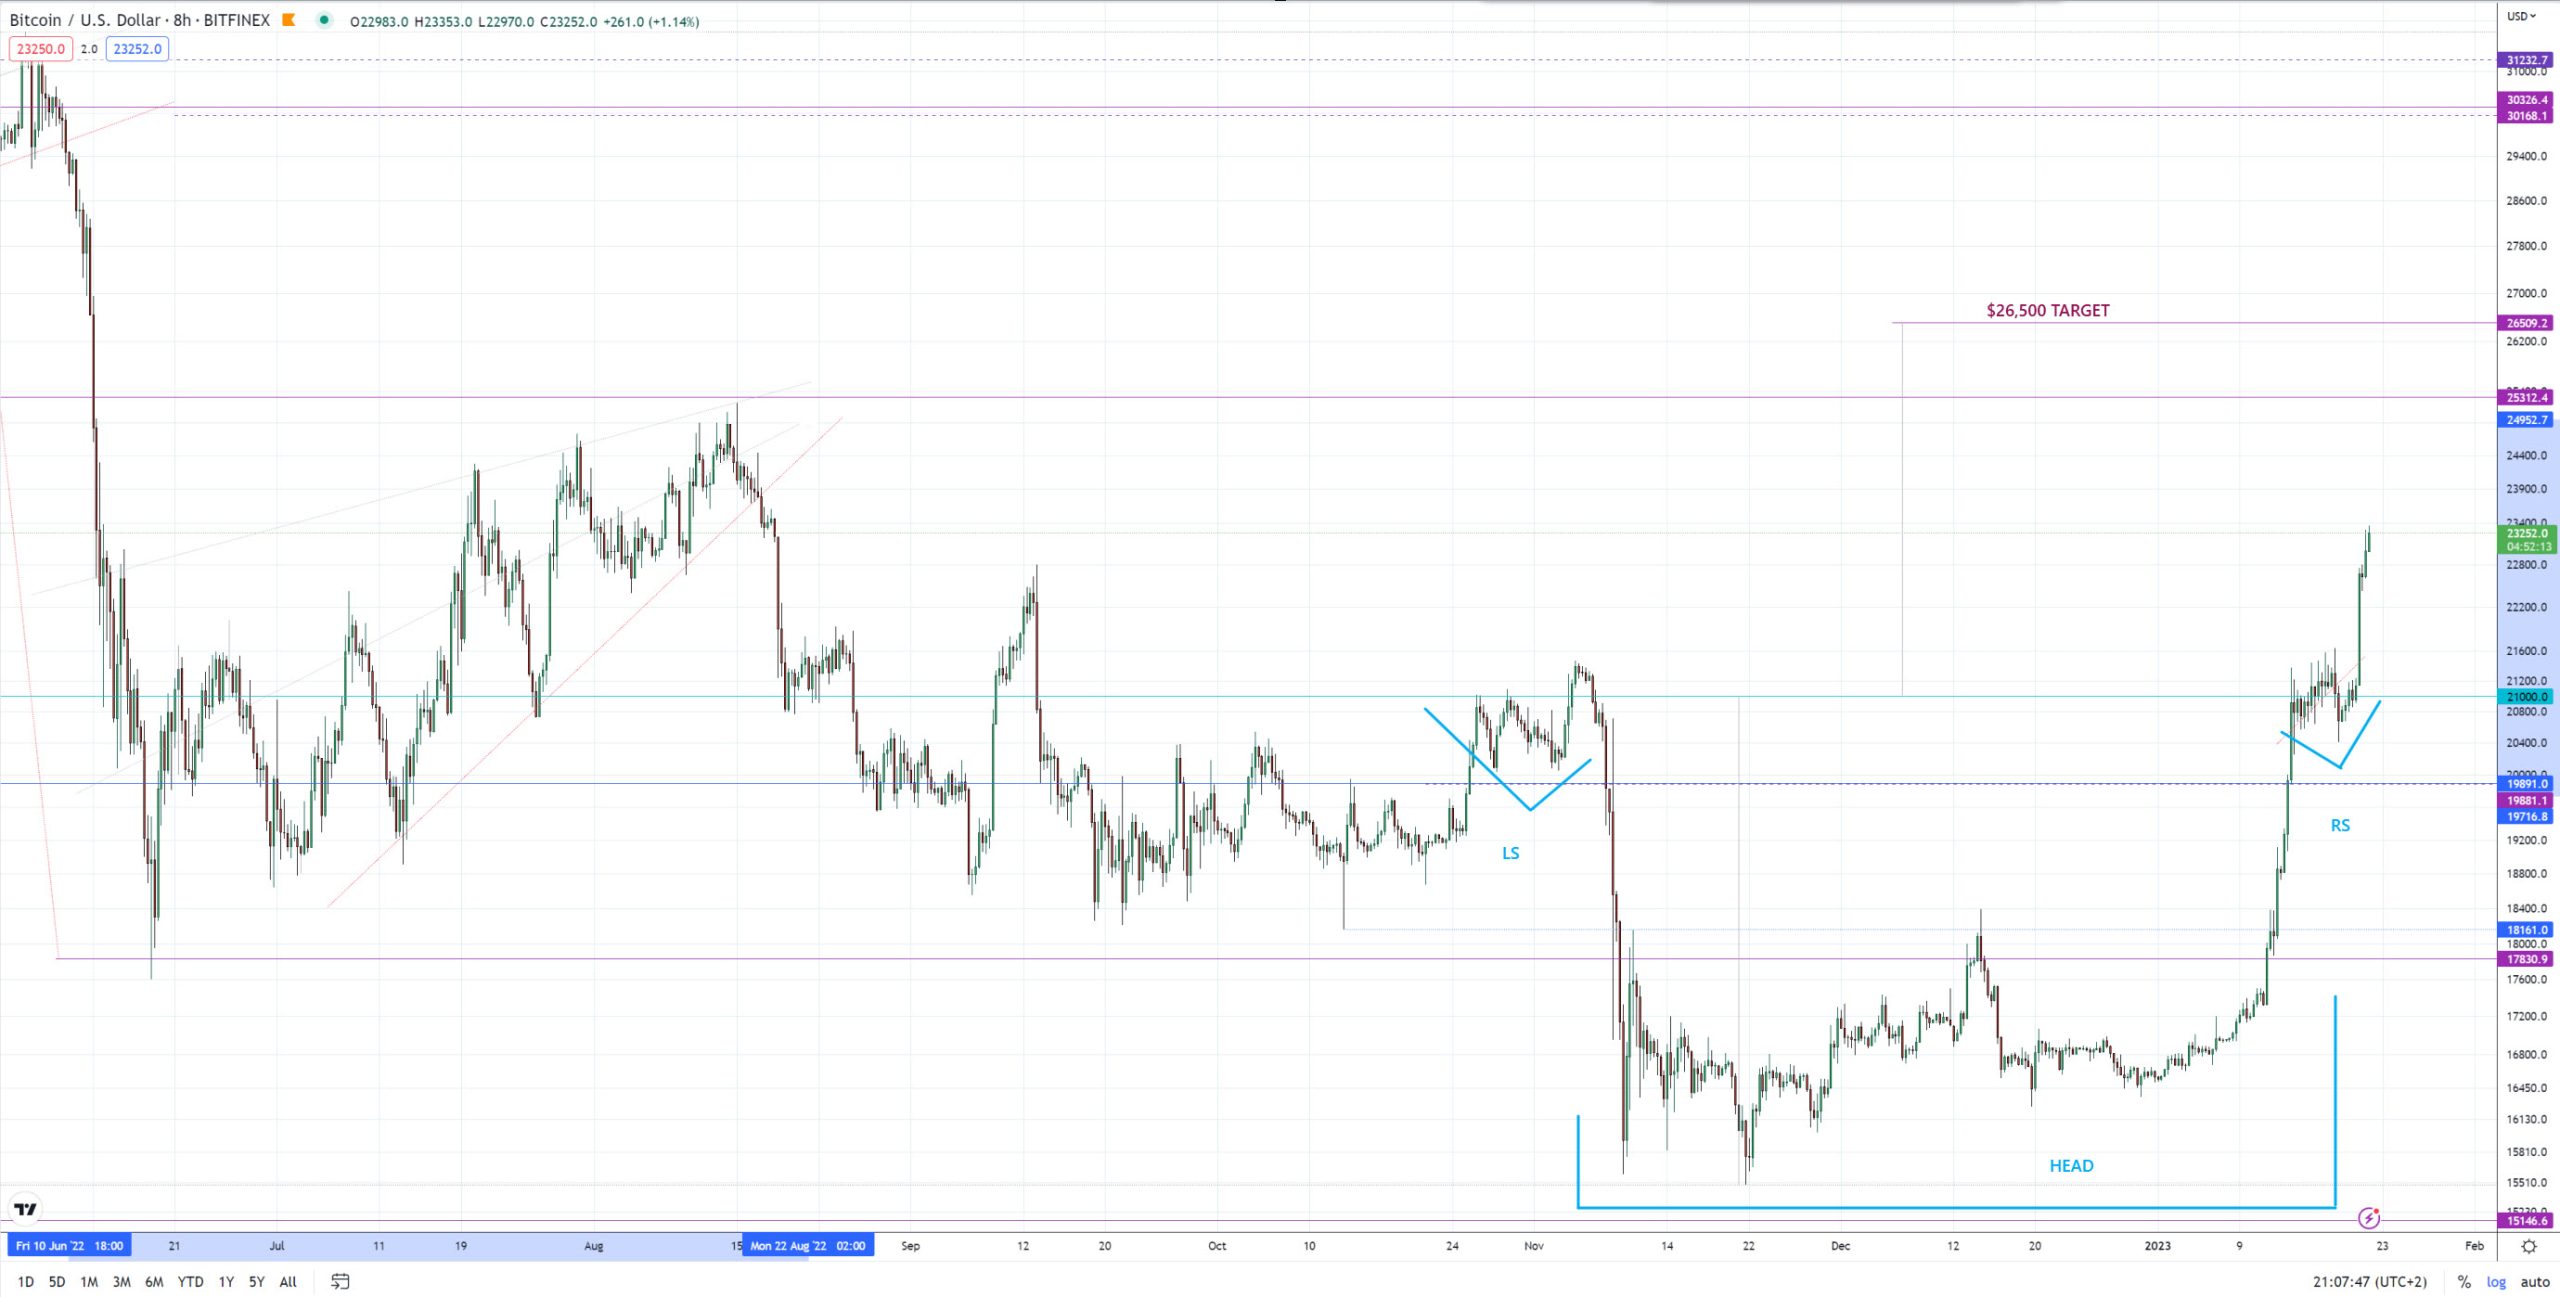
Signs are indicating a possible bull market could be on the horizon with an HVF inverted Head & Shoulders, albeit an unconventional one with a disproportionate head targeting the area of the 25K zone which we see as a very significant level.
BTC/USD 8H Possible Inverted Head & Shoulders
Inverted Head & Shoulders: Rising wedge adding pressure
Rising wedge structures are a signature of newbies chasing the price action. In this case we expected a breakout to the upside and our scoped out target of 26.5K
BTC/USD Rising Wedge
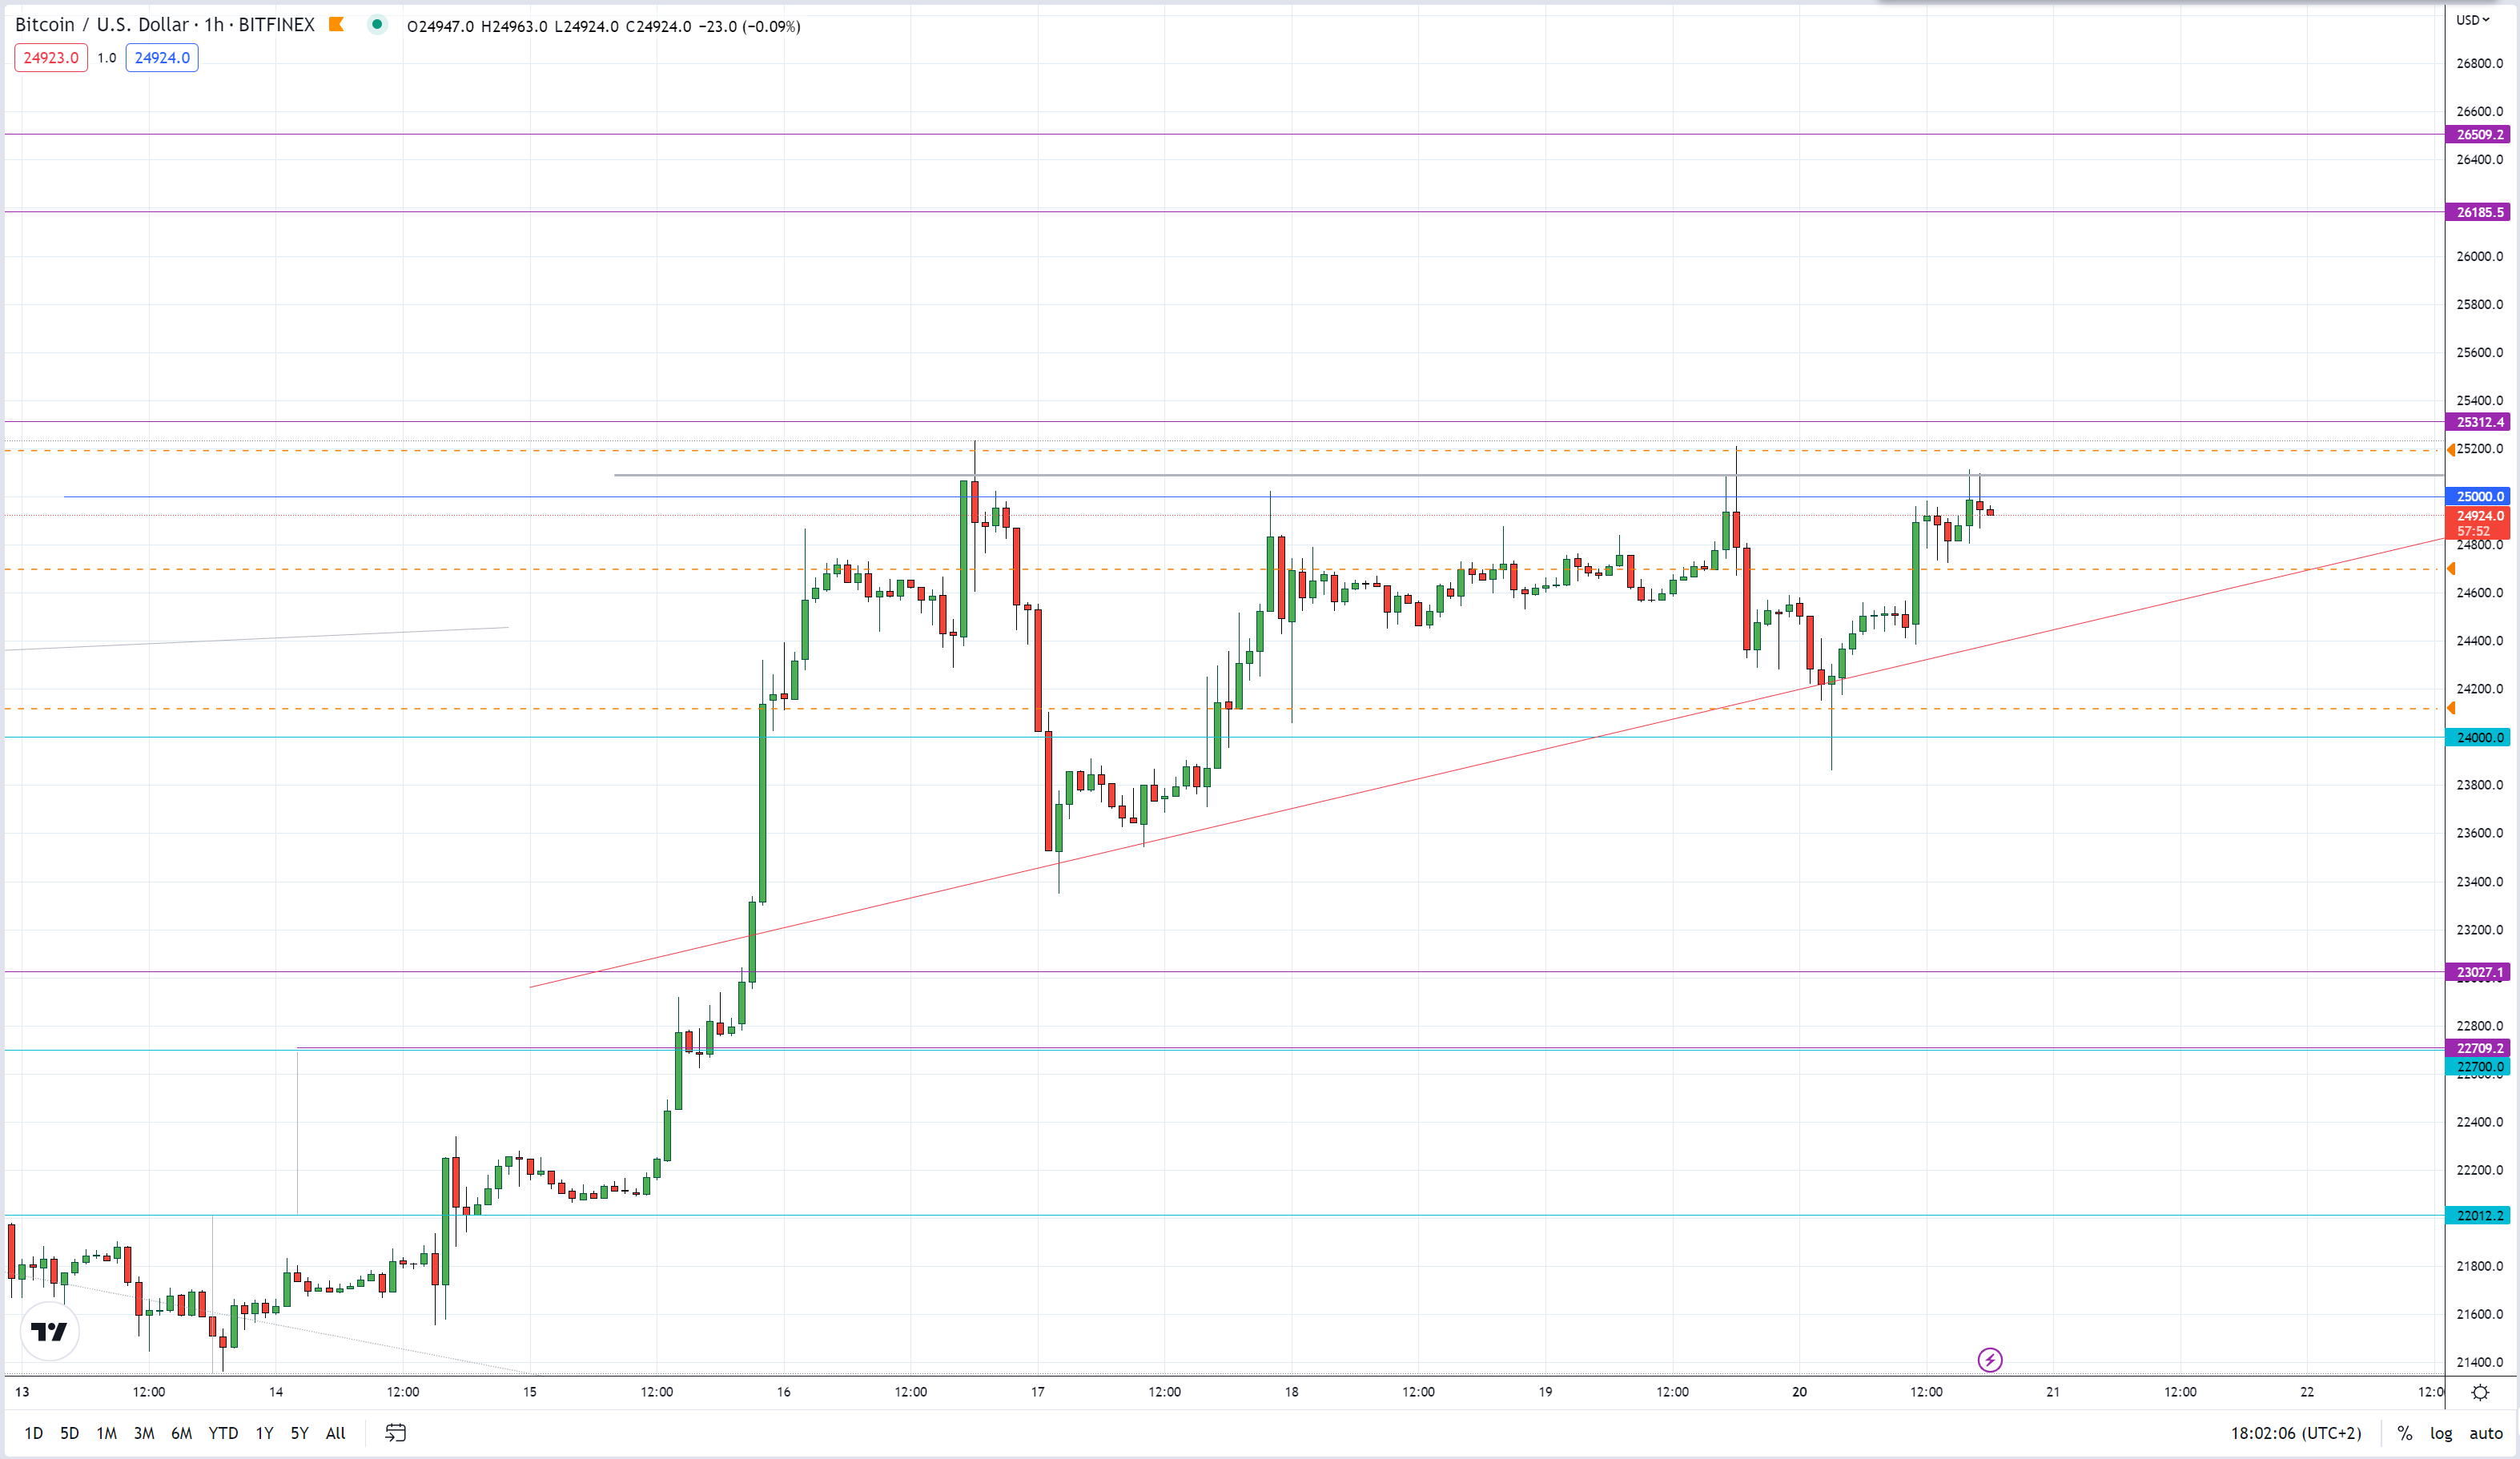
20 February 2023: So significant was this potential break of 2K we were willing to stick our necks out and make the call publicly for 40K on YouTube.
![]()
The needed sell-off before the bull commences
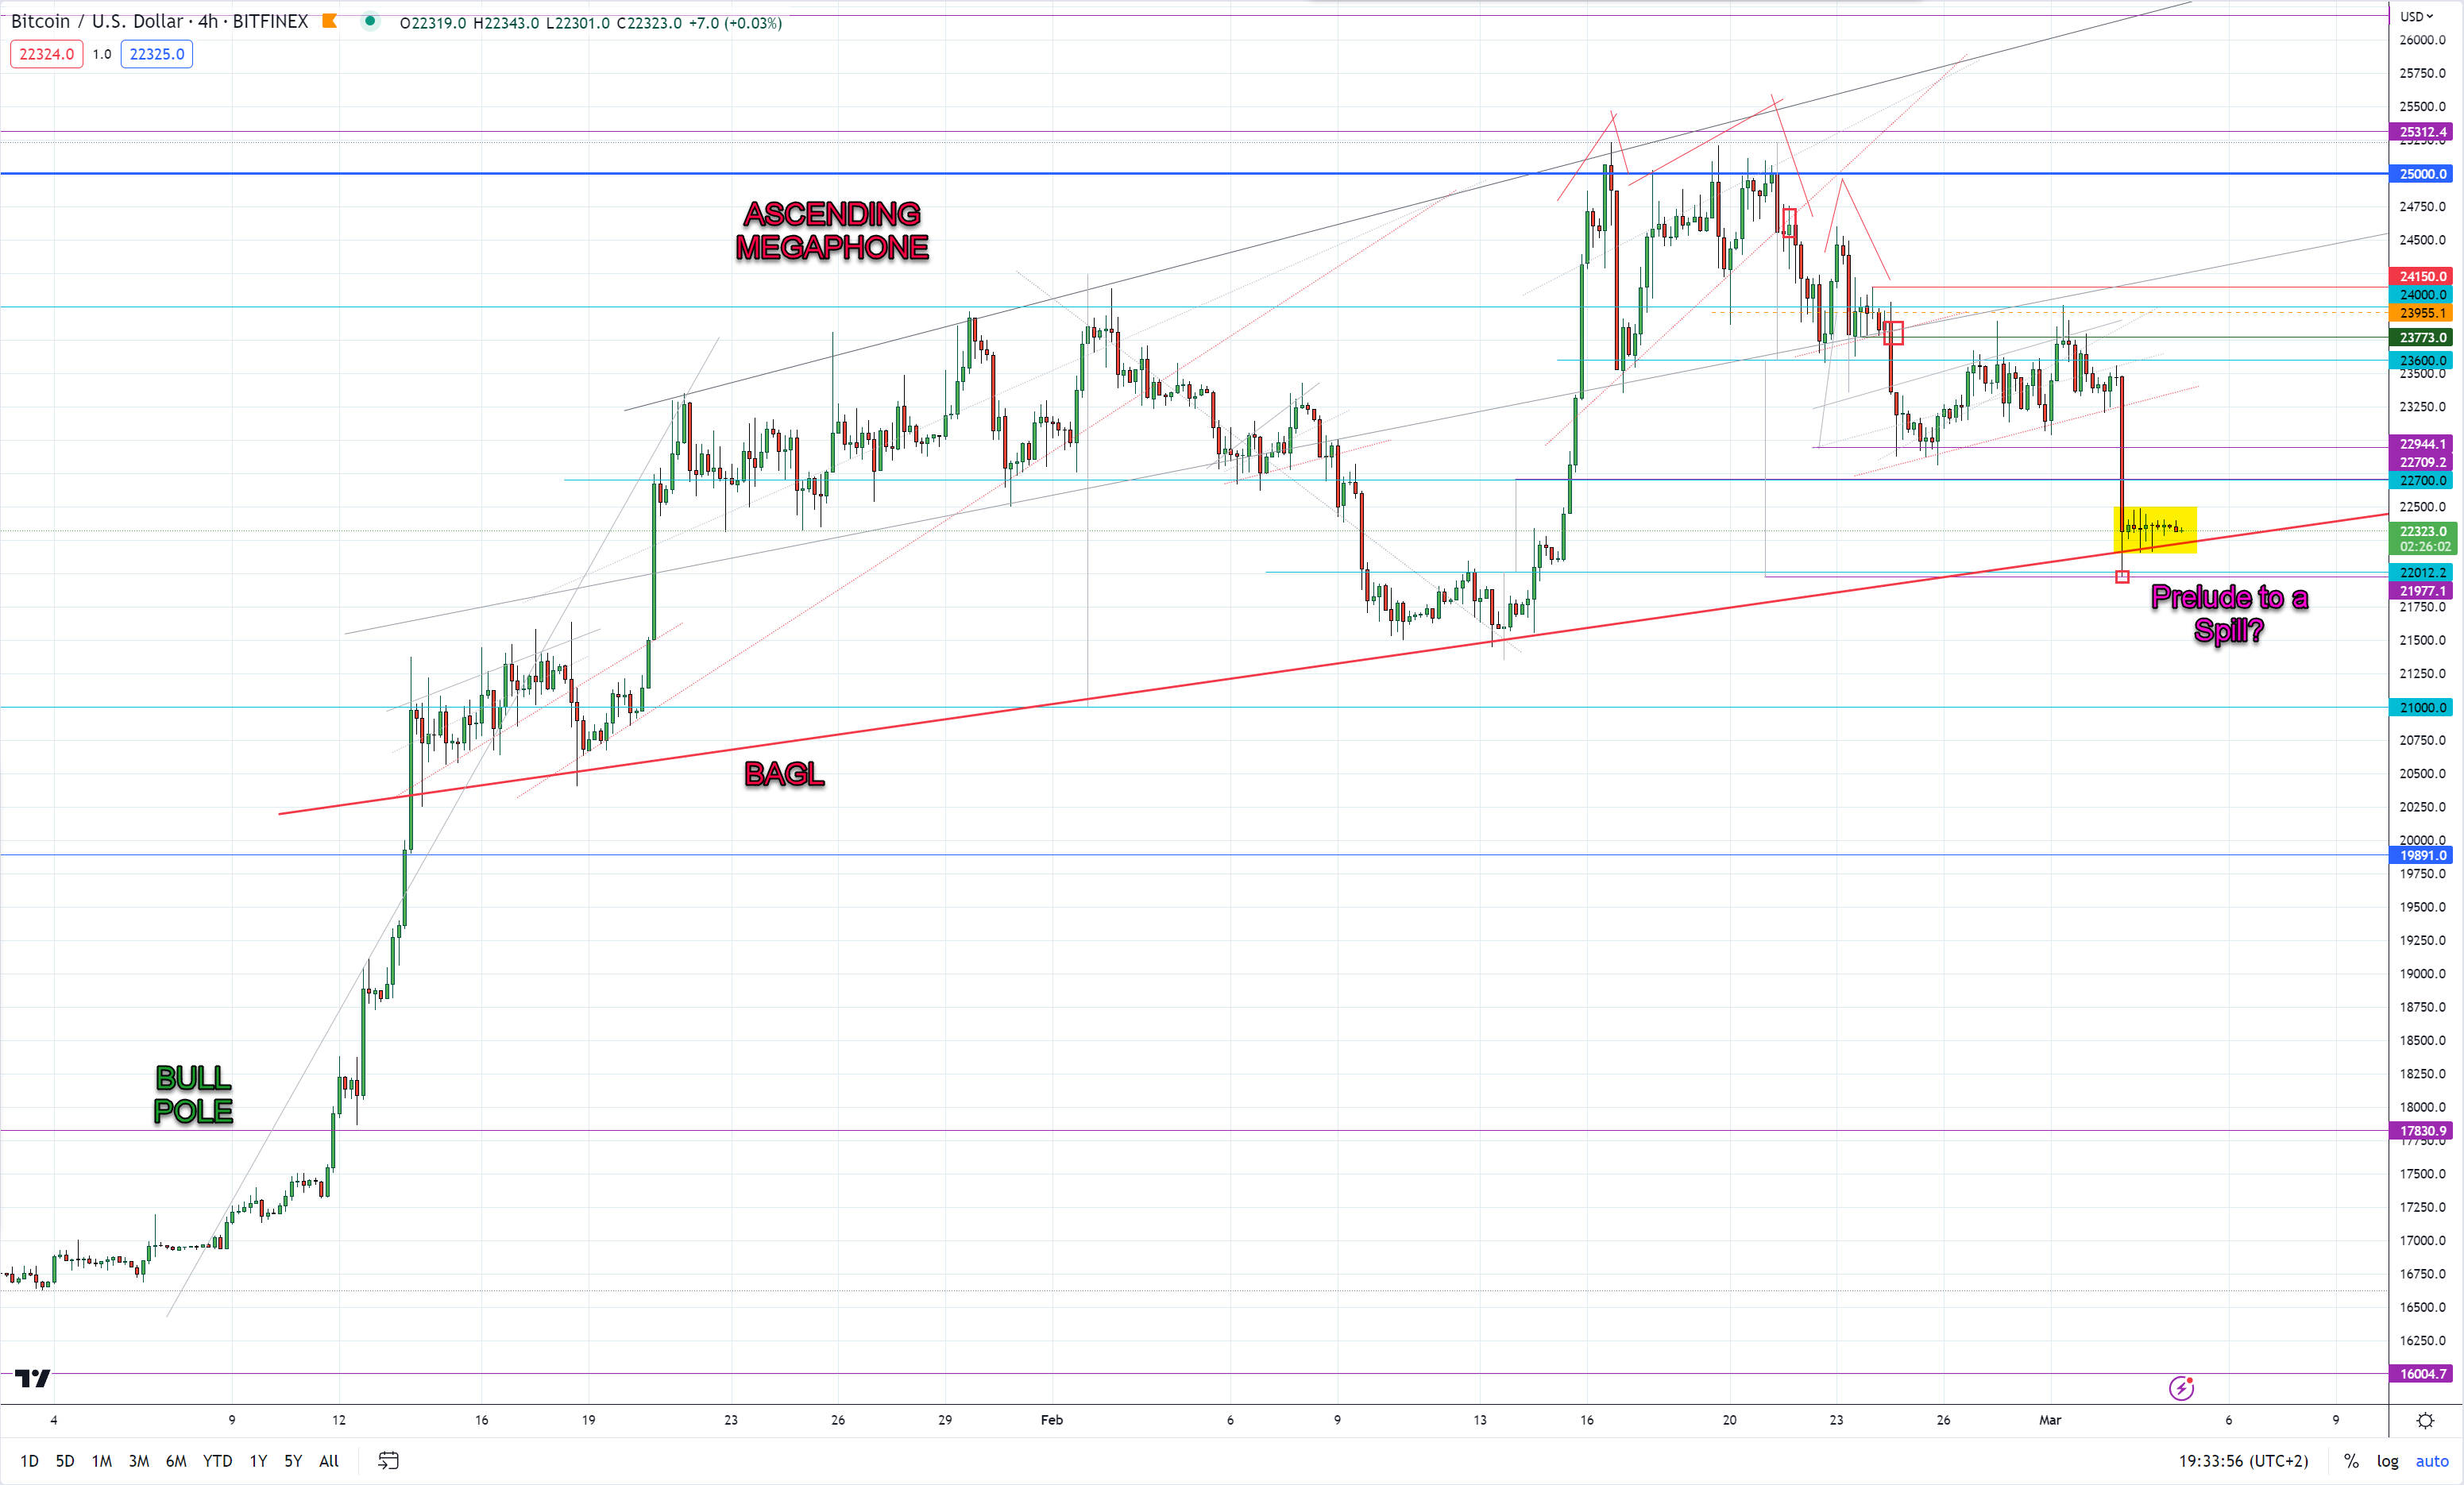
The $25K proved to much of a resistance level for BTC to overcome, repelled from the 25K in an iH&S cascading into a broadening structure that we technically see as a bearish development pointing to further downside price action.
BTC/USD 4H Looking to spill
And down shes goes. Bitcoin smashes down out of the Ascending Broadening structure as FUD on SEC, crypto banks, and liquidity escalates.
BTC/USD 4H Spill out of Broadening Structure
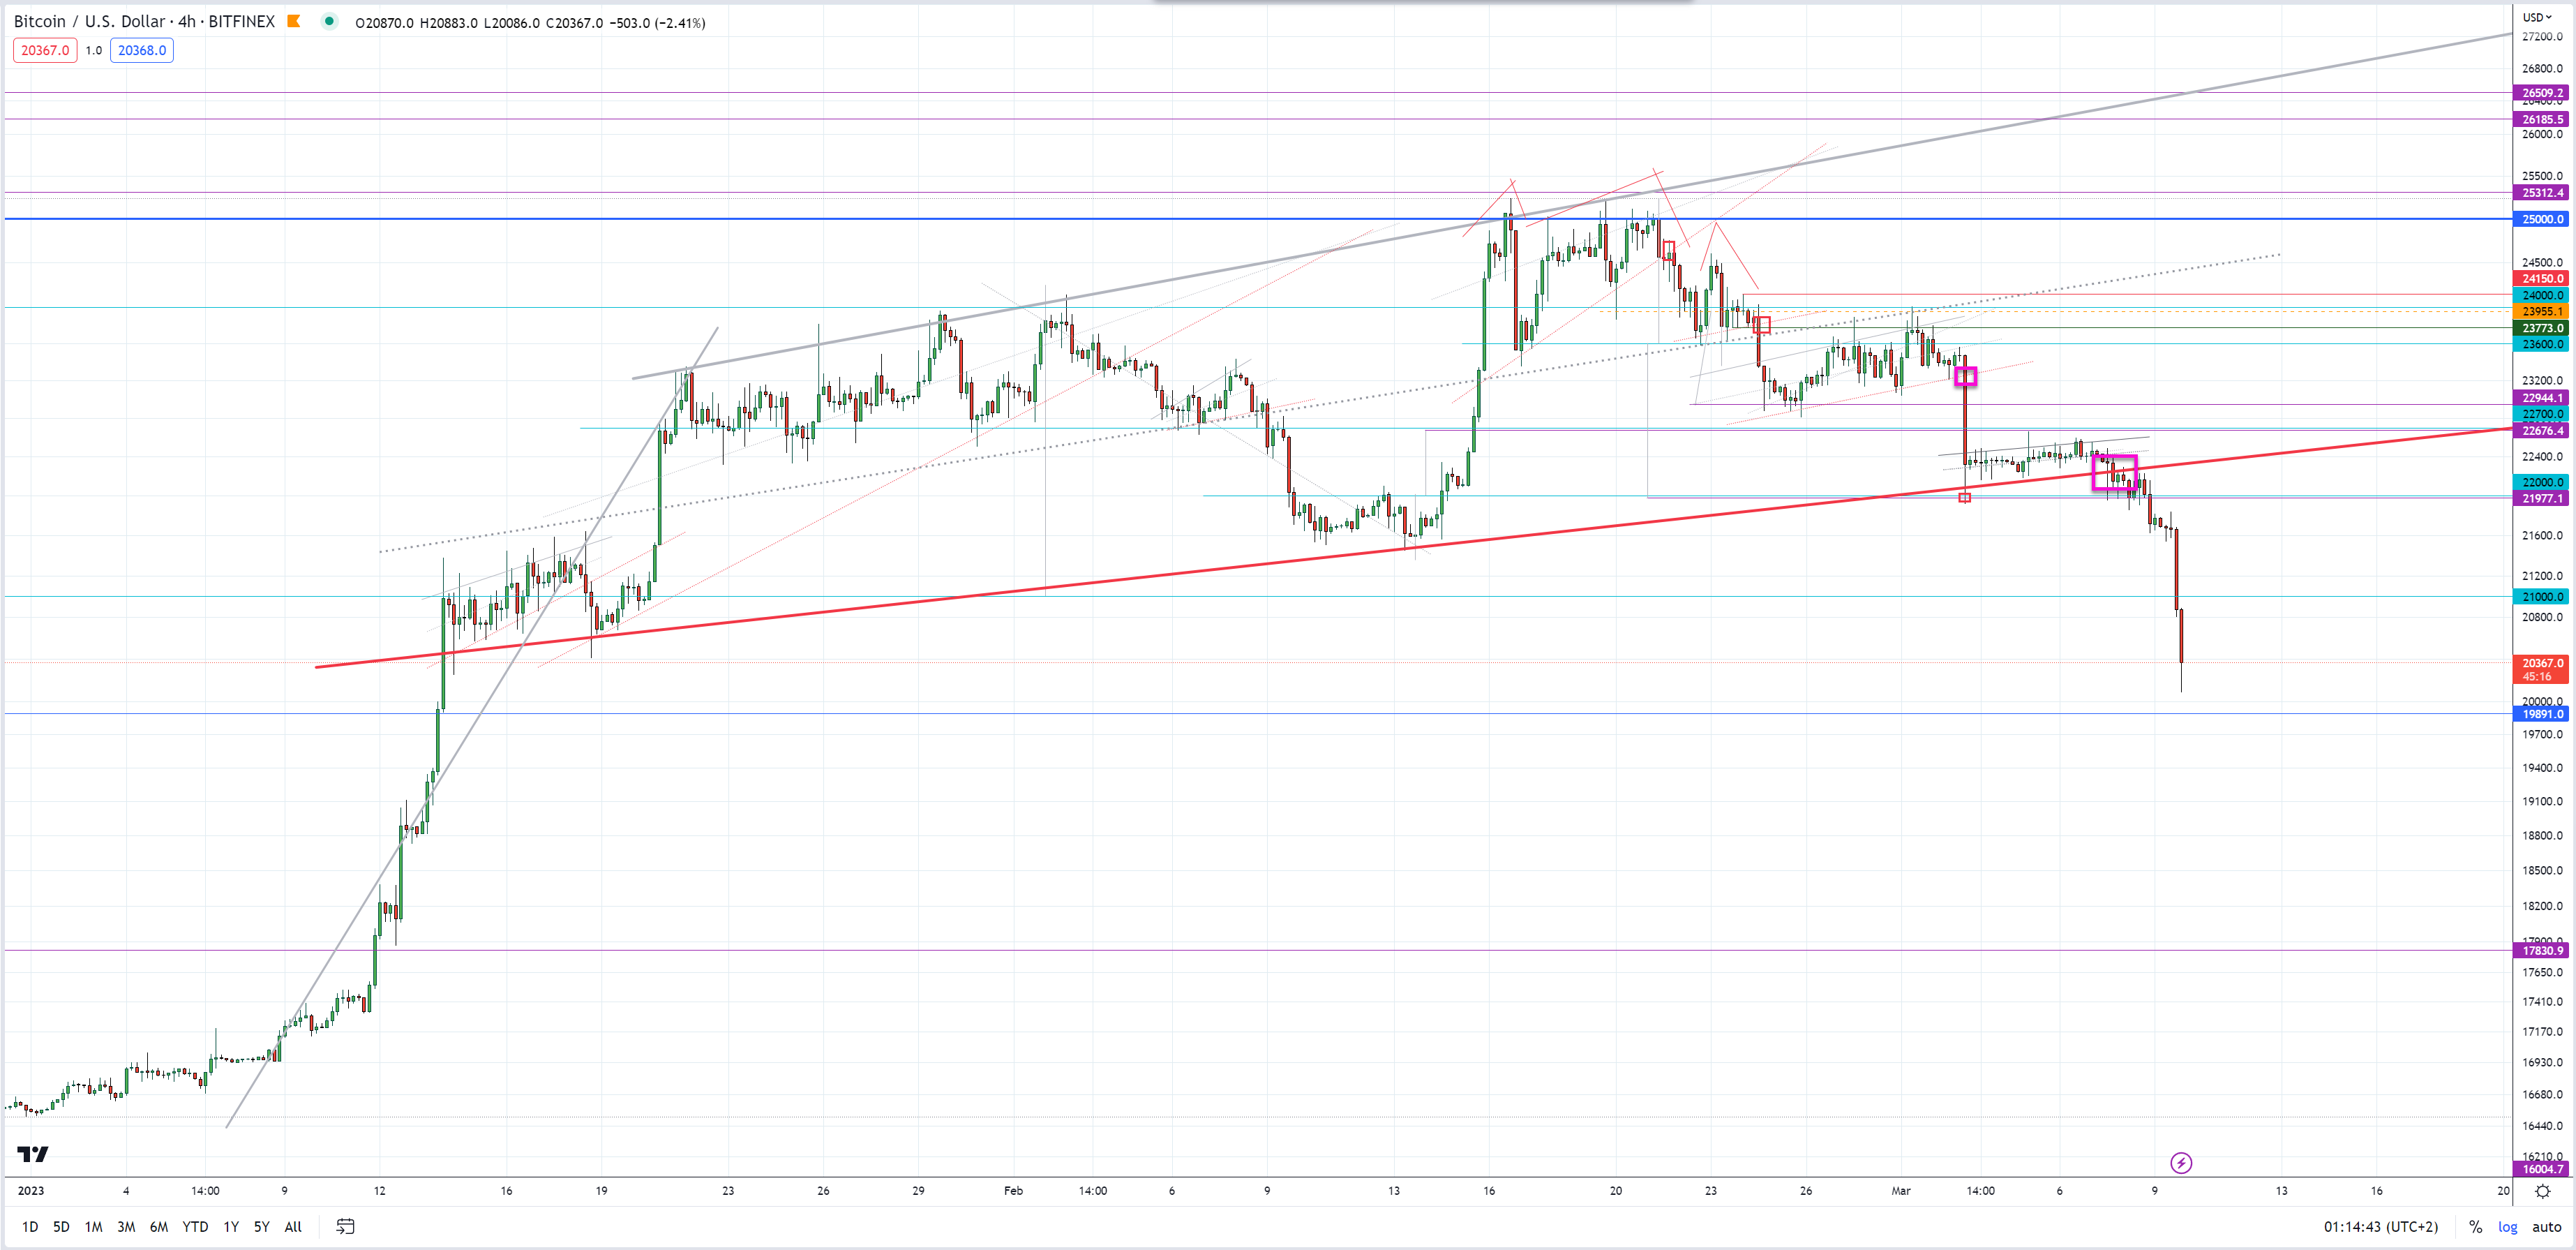
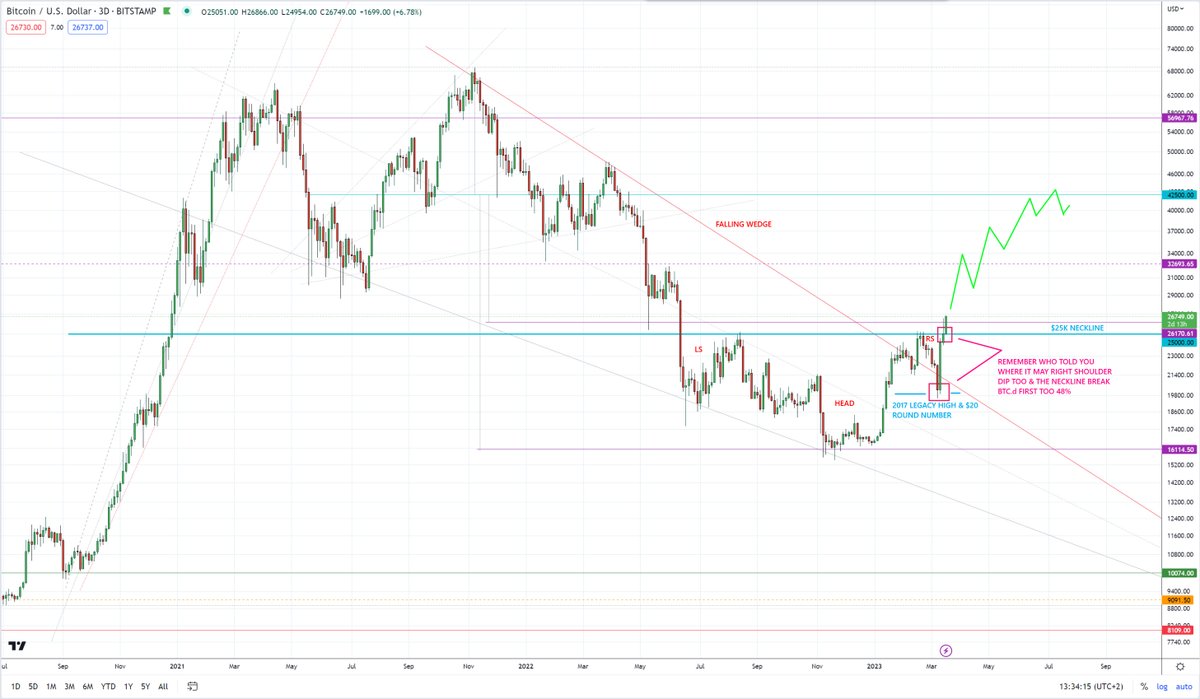
This spill allowed BTC to make a better structured iH&S and a more proportionate Right Shoulder along with a Falling Wedge to break the 25K level. It was the sell-off that was needed before the buying starts again.
Tweeted out our scenariocast, with a pause at 30K before possibly moving onwards to 40K.
BTC/USD 3D scenariocast: Girding our loins for the next leg
Our public YouTube 13 March 2023 brings attention to the potential trigger of the inverted Head & Shoulders at the 25K key level
The YouTube highights where the spill from the broadening structure stalled and reversed up – levels that only we had – the legacy 2017 high and the 20K level.
We go futher into detail how technically, price action was behaving during this reversal with specific HVF-derived levels.
A look at the BTC dominance chart our bull flag targets the 47.5% – 48% level giving a solid backing to our BTCUSD call of 40K. With such a increase in dominance, BTC is the safest trade for crypto at this time with biggest marketcap and liquidity availability.
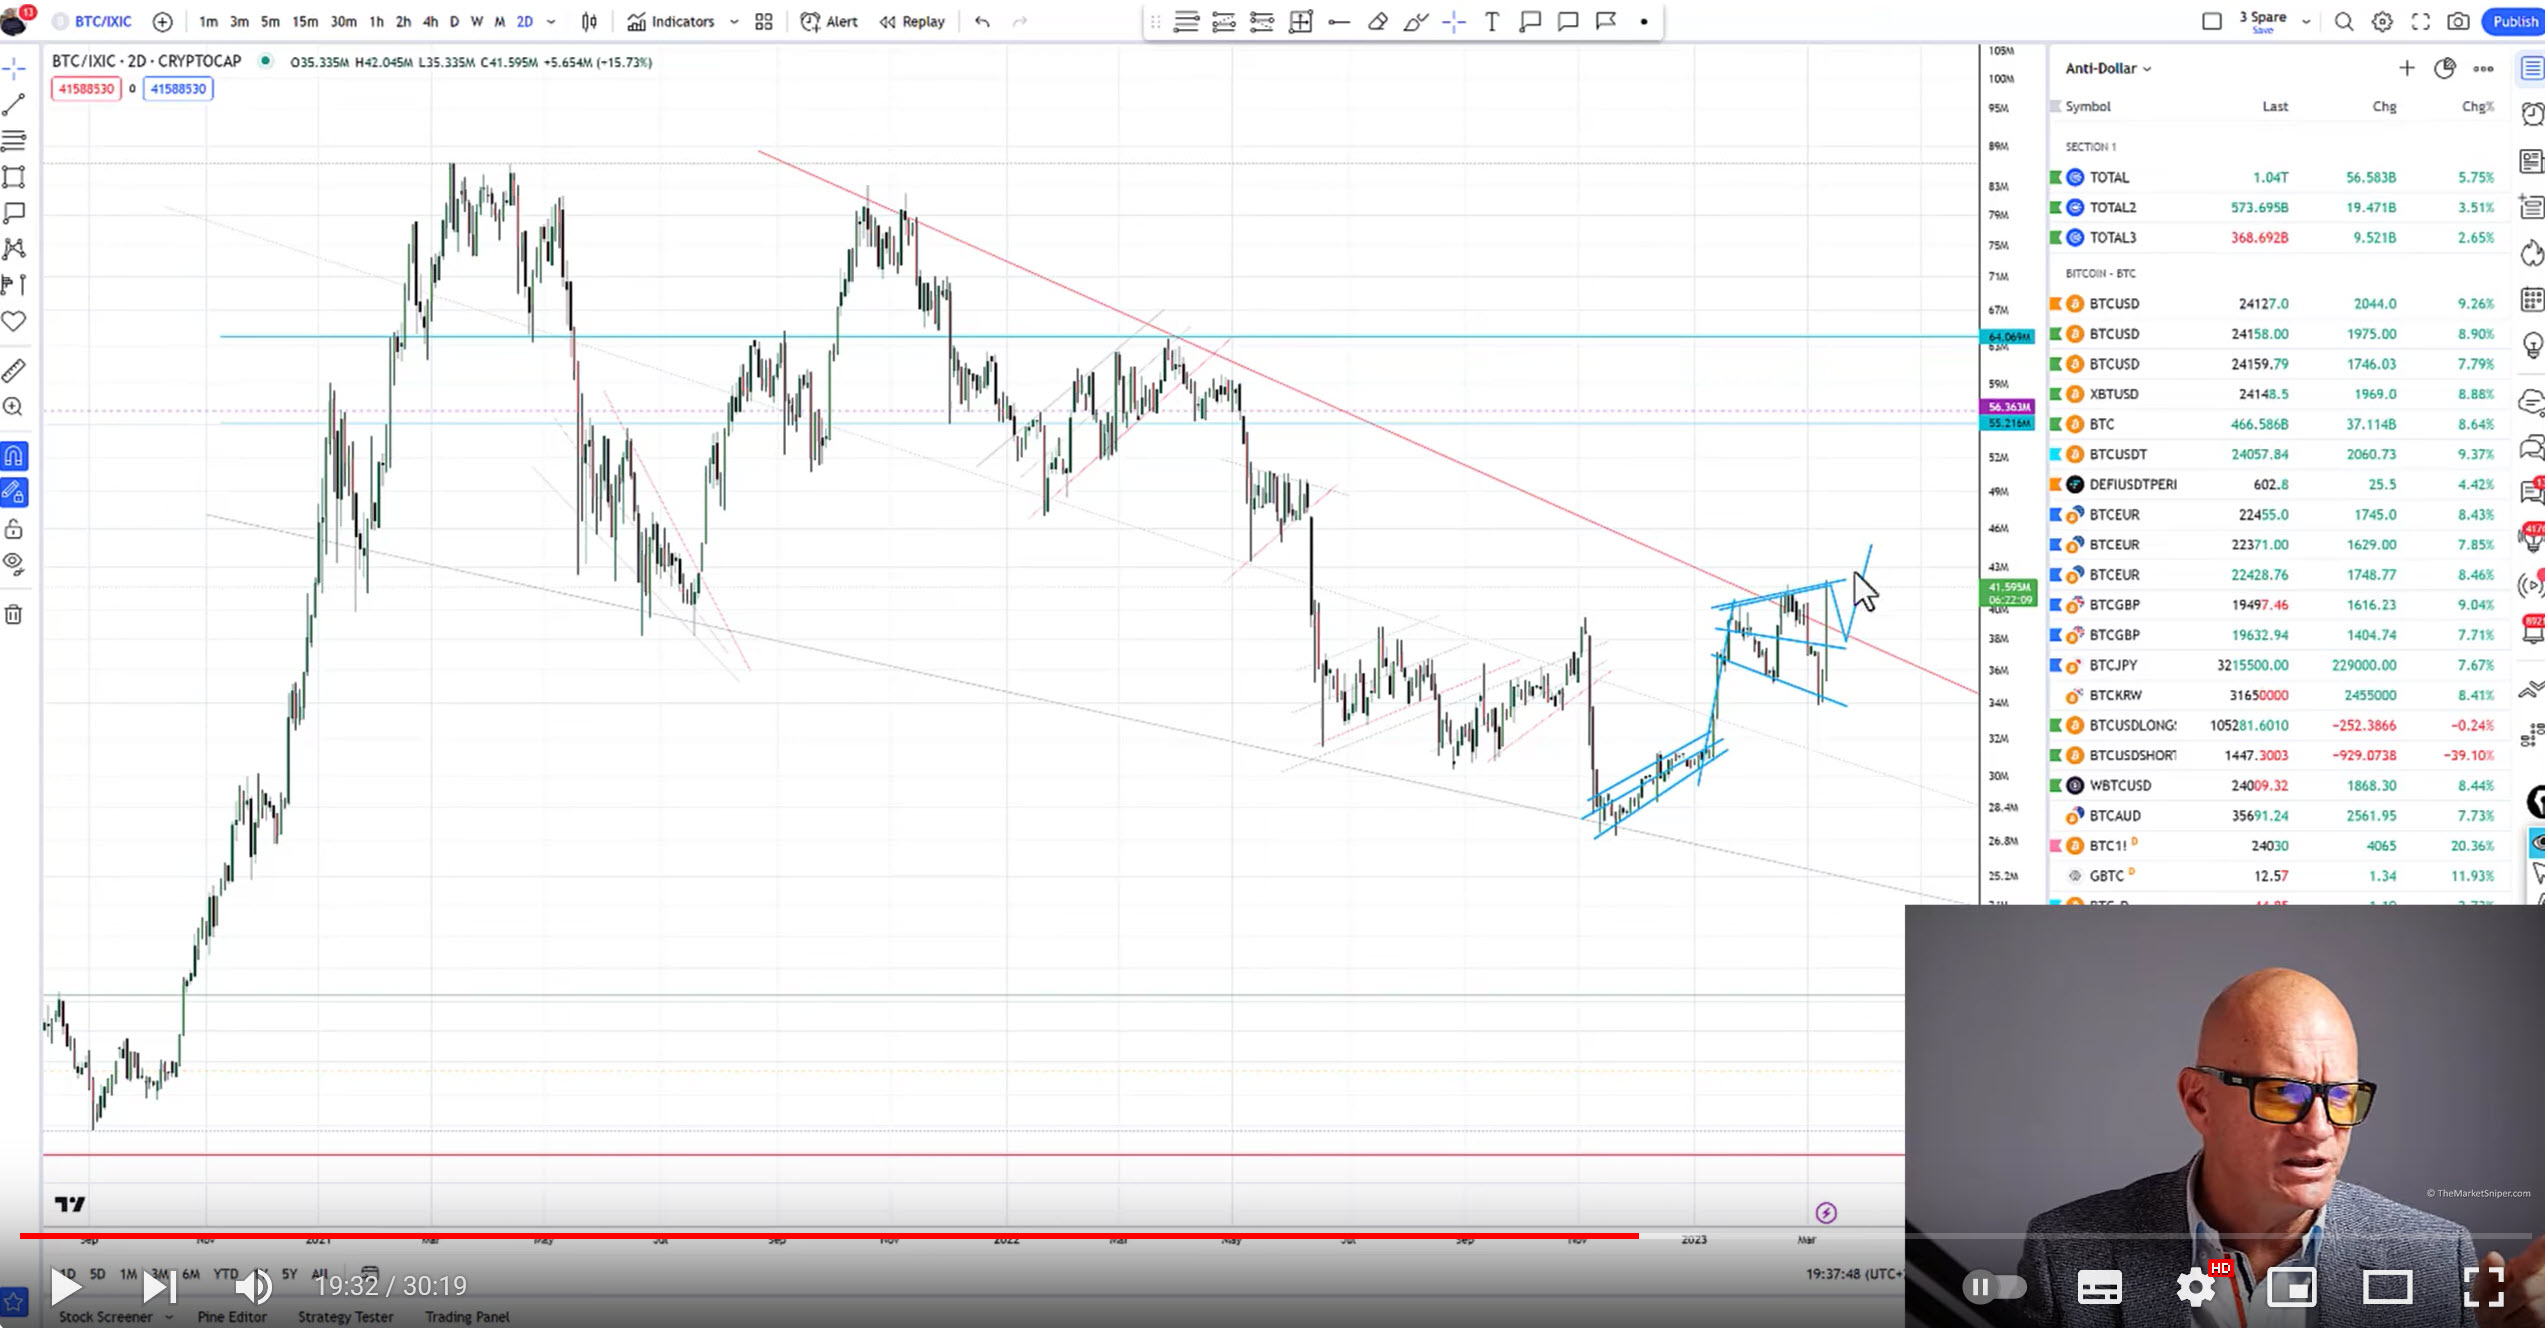
Further reinforcement to our position is indicated by a bullish break of a Falling Wedge by Bitcoin when we compare Bitcoin and Nasdaq as seen from a screenshot of the YouTube below:
BTC/IXIC 2D : break of a Falling Wedge is bullish in our view
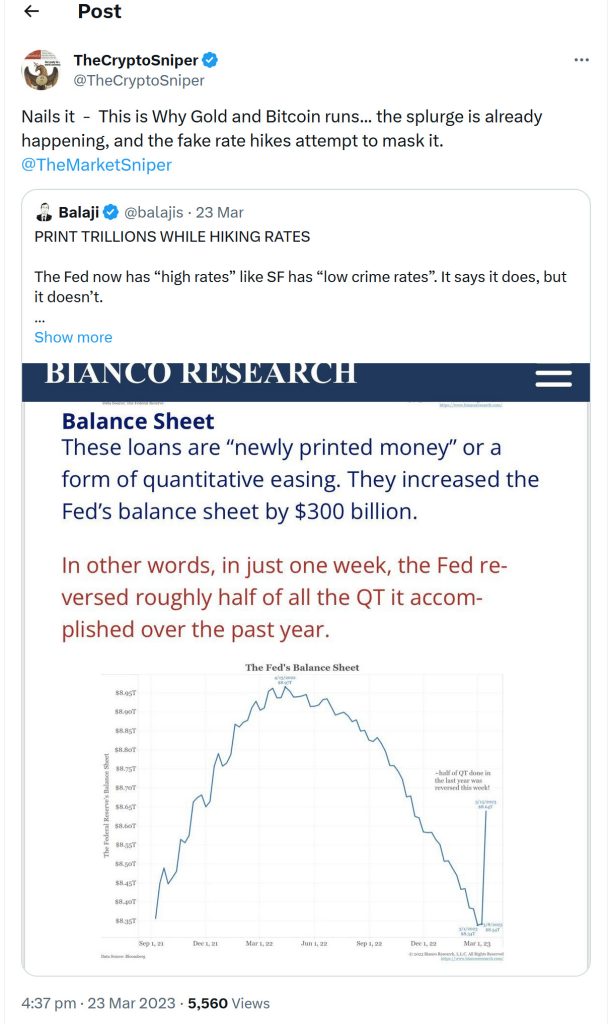
Why did Bitcoin (and Gold) run?
Fake rate hikes and massive “printing” of currency saw an increase of $300 billion to the Fed’s balance sheet.
As the tweet below illustrates, the Fed’s splurge in one week reversed the past years worth of quantative tightening.
That new currency needed to go somewhere…
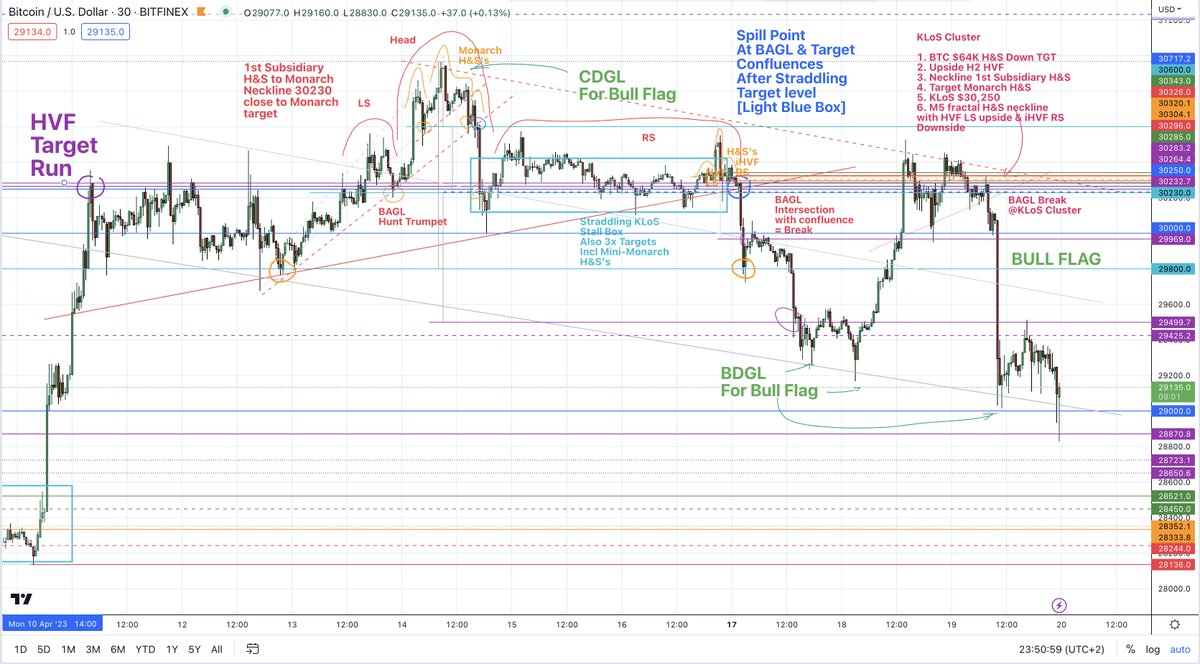
30K key level falls as Bitcoin marches on
The 30K level falls and as almost always, Key Levels are broken with momentum. When Key Level have been broken, we expect either a pause, churn or pullback.
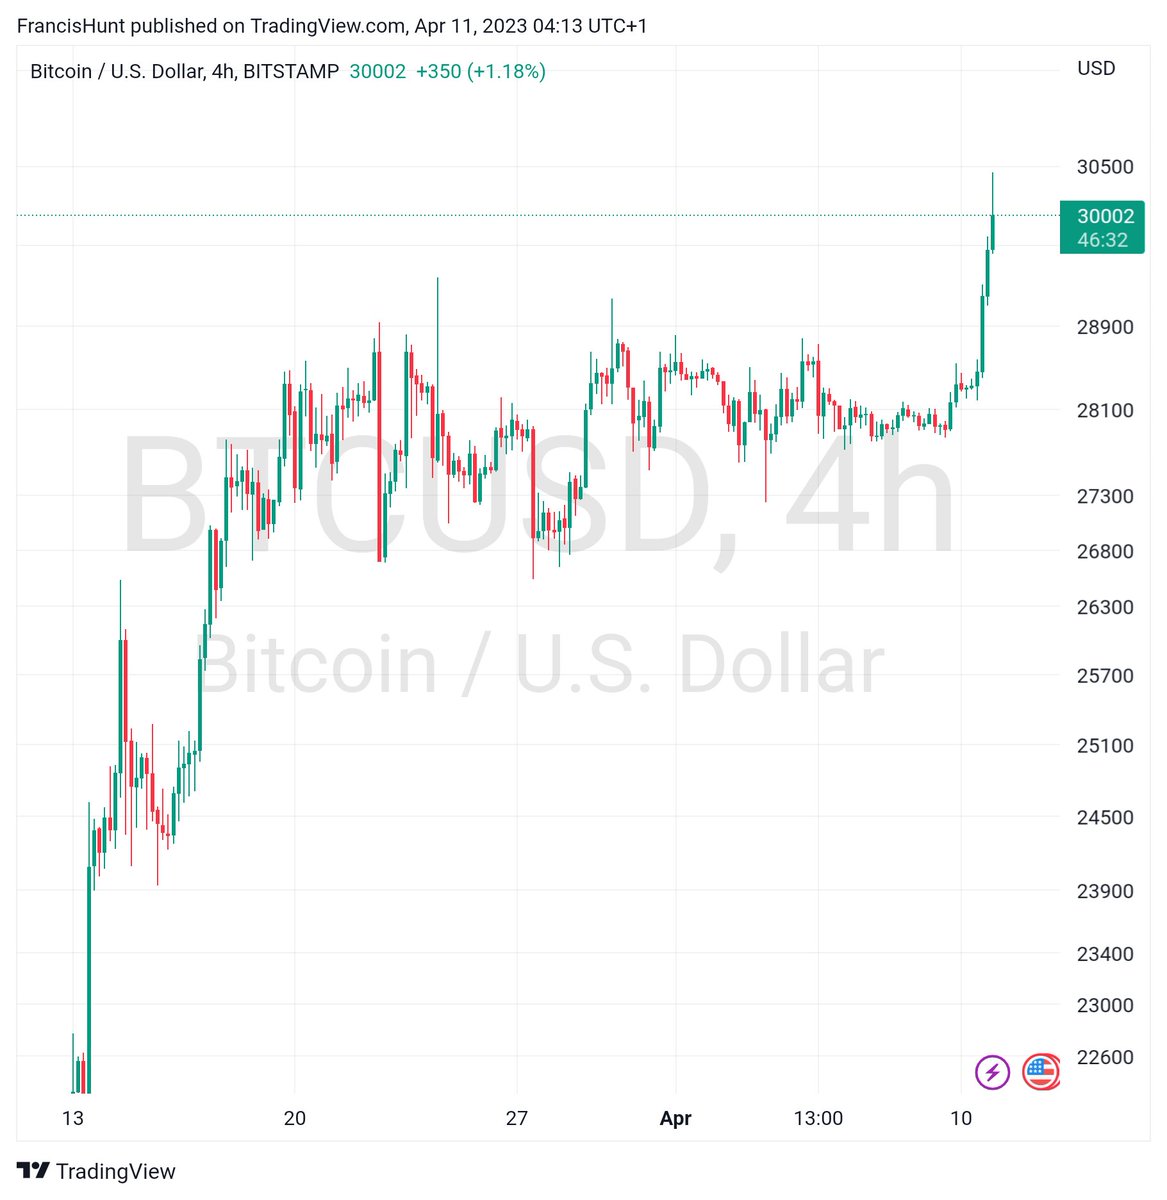
A pullback would offer a great dip buy opportunity before commencing an assault on the 40K level.
We highlight this opportunity to buy on a pullback in a YouTube despite some perma-bears calling this move above 30K a bear market rally.
Bias at this stage is strongly bullish for investment and selective leveraged long trades.
An excellent investment entry point for Bitcoin was highlighted in a tweet accompanied by a detailed technical chart at $28,650.
27 April 2023
Bitcoin dominance shows potential for a breakout having formed a complex yet substantial Inverted Head & Shoulders structure consolidating arounf the 48% level. Dominance had been caught in an entrapment box for the better part of two years and now looking to escape that entrapment box and seek to break the 50% dominance level.
Our scenariocast put forward the idea that this imminent break out could be indicating an incoming fiat crisis.
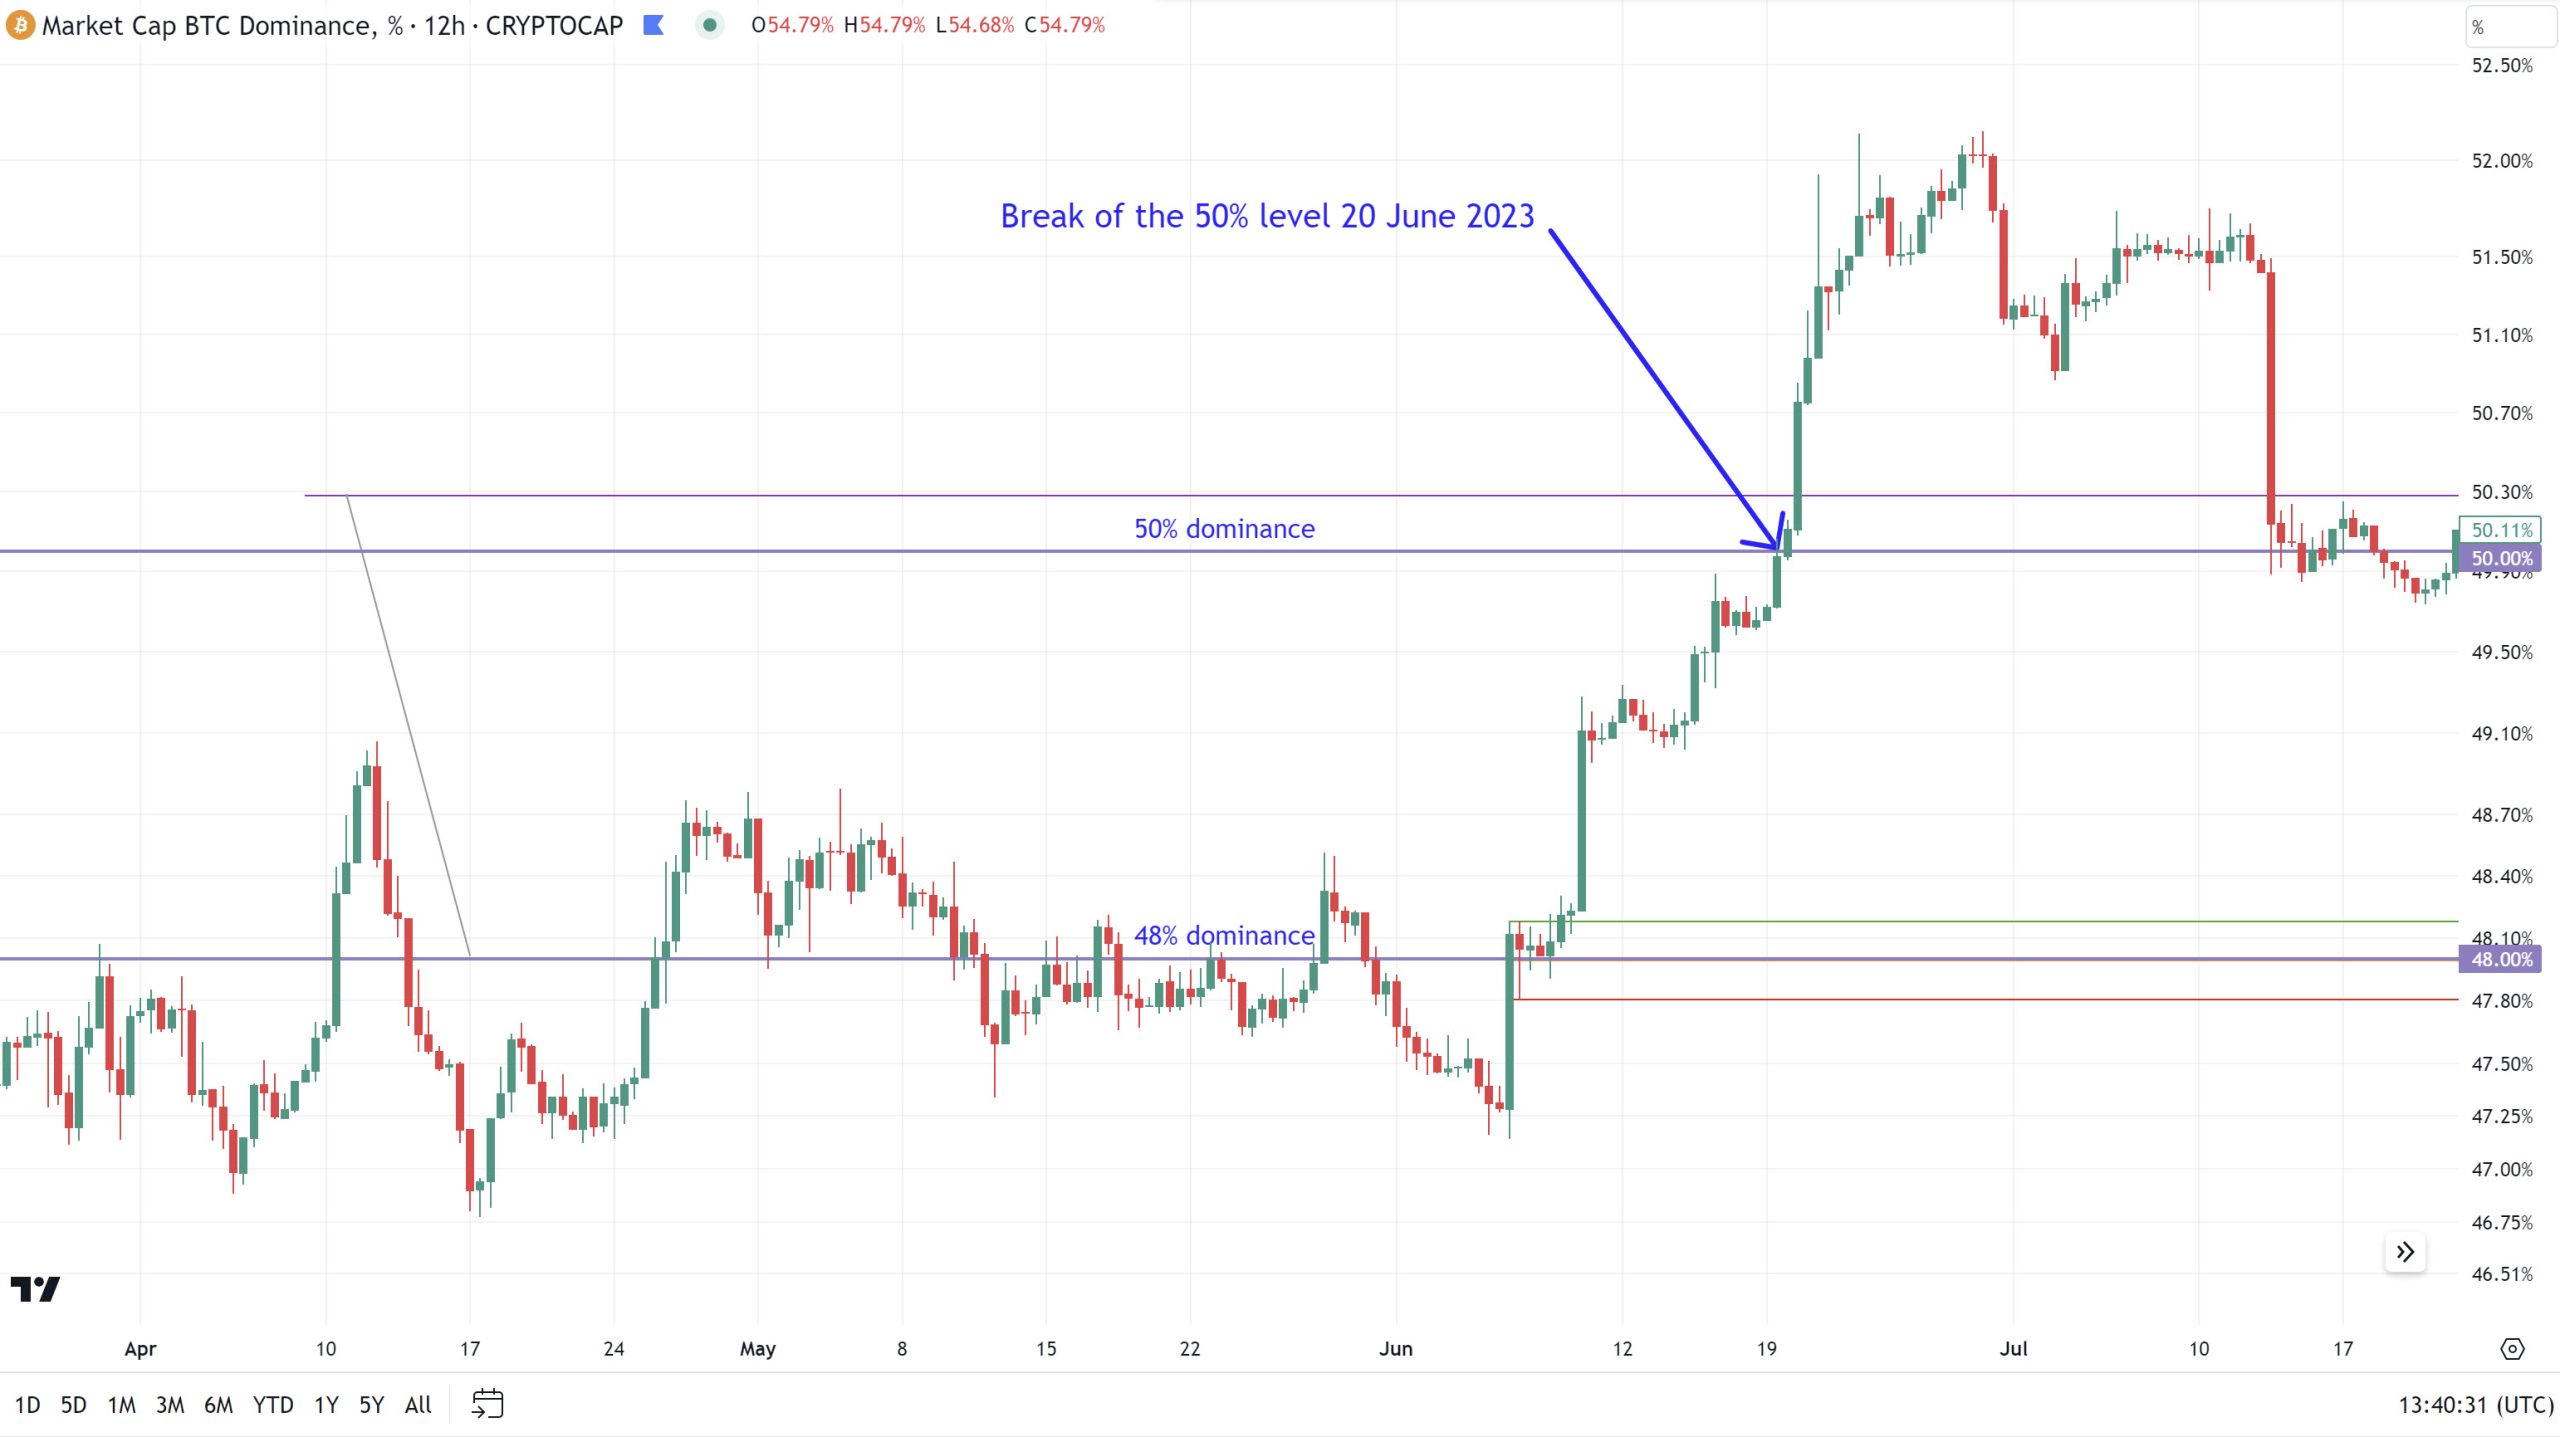
An HVF Structure subsequently formed on the dominance chart to take it through the 50 level around 20 June 2023 which coincided with Bitcoins price breaking 30K for the second time in 2023. Maitaining a stall box between 25K and 32K until October it began its run for 40K.
HVF structure that took BTC dominance above 50% on the 20 June 2023 and BTC price through 30K.
BTC.D 12H 50% Dominance breached
CCL and PAA trades
Auxilliary trades related to oil showing weakness.
Carnival Cruise Line (CCL) is a British-American cruise operator founded in 1972 with a combined fleet of over ninety vessels across nine cruise line brands.
CCL had been forming an inverted HVF over the past six months pointing to a possible spill from around mid-June to July 2019 based on oil’s macro signs of weakness.
CCL (4H)

Spilla-Thrilla
CCL triggers right on time and fell hard.

Subsequent strong recovery on the back of reflation took the price back to the funnel but did not invalidate the setup.
Eventually CCL made it’s HVF Method-derived and pre-determined target of $30.84
Plains All-American (PAA) was on the verge of triggering showing extreme weakness. Community members who had elected to join the trade with early entries were already in the green, waiting for the official trigger of PAA’s pattern. Myself and some of the community were in at the $24.50’s with early entries shorting it to sub $3
Original long form video can be found here:
Long form Plains All American Pipeline PAA, For whom the Grandfather clock tolls CCL, WFC Update![]()
We’ve been here before…
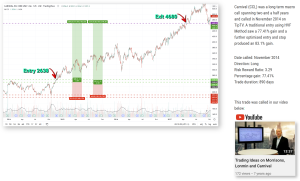
This is not our first time trading Carnival Cruise Lines. As highlighted in the short above, we traded CCL to the upside before calling it short.
Click the image below to see our call to trade CCL to the upside from November 2014 that saw a handsome 77% gain.
CCL November 2014 long call
Epilogue - Top call after break of macro Falling Wedge
USD/WTI 2H
As an epilogue to the final capitulation to the low levels for oil and break of the Falling Wedge, we asserted on the 8th March 2022 that oil had made a top at $129.47 on the 9th February 2023.
In this view we illustrate: a breakaway from the Falling Wedge (it gapped on lower timeframes); the running and holding above $100; the subsequent battle to retain that which led to an ascending broadening structure that is sitting on a bullish green pole.
This is classic HVF Method for the expectation of a reversal.
Calling it at the time
USD/WTI 1H

In the rally that formed part of a break of the macro Falling Wedge into the levels above $100 there was a final exhaustive gap up that was filled on the downleg with a subsequent clinging, grinding price behaviour in and around the splitter of our Ascending Megaphone, which is very typical in HVF Method for price weakness to subsequently occur. The break occurred in the $126 to $124 range of the Megaphone splitter consolidation area shown as the tight channel in pink. The price subsequently spilled even further breaking the Megaphone Basing Ascending Grindline at approximately the $116 level.
This exhaustive behaviour between the 6th and 10th March 2022 was indicative that the oil markets had topped. This was a market we were observing closely and even suggested that oil’s upside had exhausted and a downturn was due.
Looking forward to today (9th February 2023) oil is trading $75 and has never made another high.
This chart illustrates the high call where a stop loss was placed at $129.47
Having called the collapse of oil to single digits, and the subsequent reversal, we captured the high of the rally that still holds true a year later, to where we are now (Ferbruary 2023) trading down at $75 along with talk of recession and tightening interest rates in a far more muted and contracting global economy.
Oils event timeline
2001 to 2023

Walk-through of the oil trade with Francis Hunt, The Market Sniper